

Question: Calculate M score(five variable model) and show your workings for it. Also discuss any red flags General Illinois Municipal Retirement Municipal Sales Tax Capital Development
Calculate M score(five variable model) and show your workings for it. Also discuss any red flags
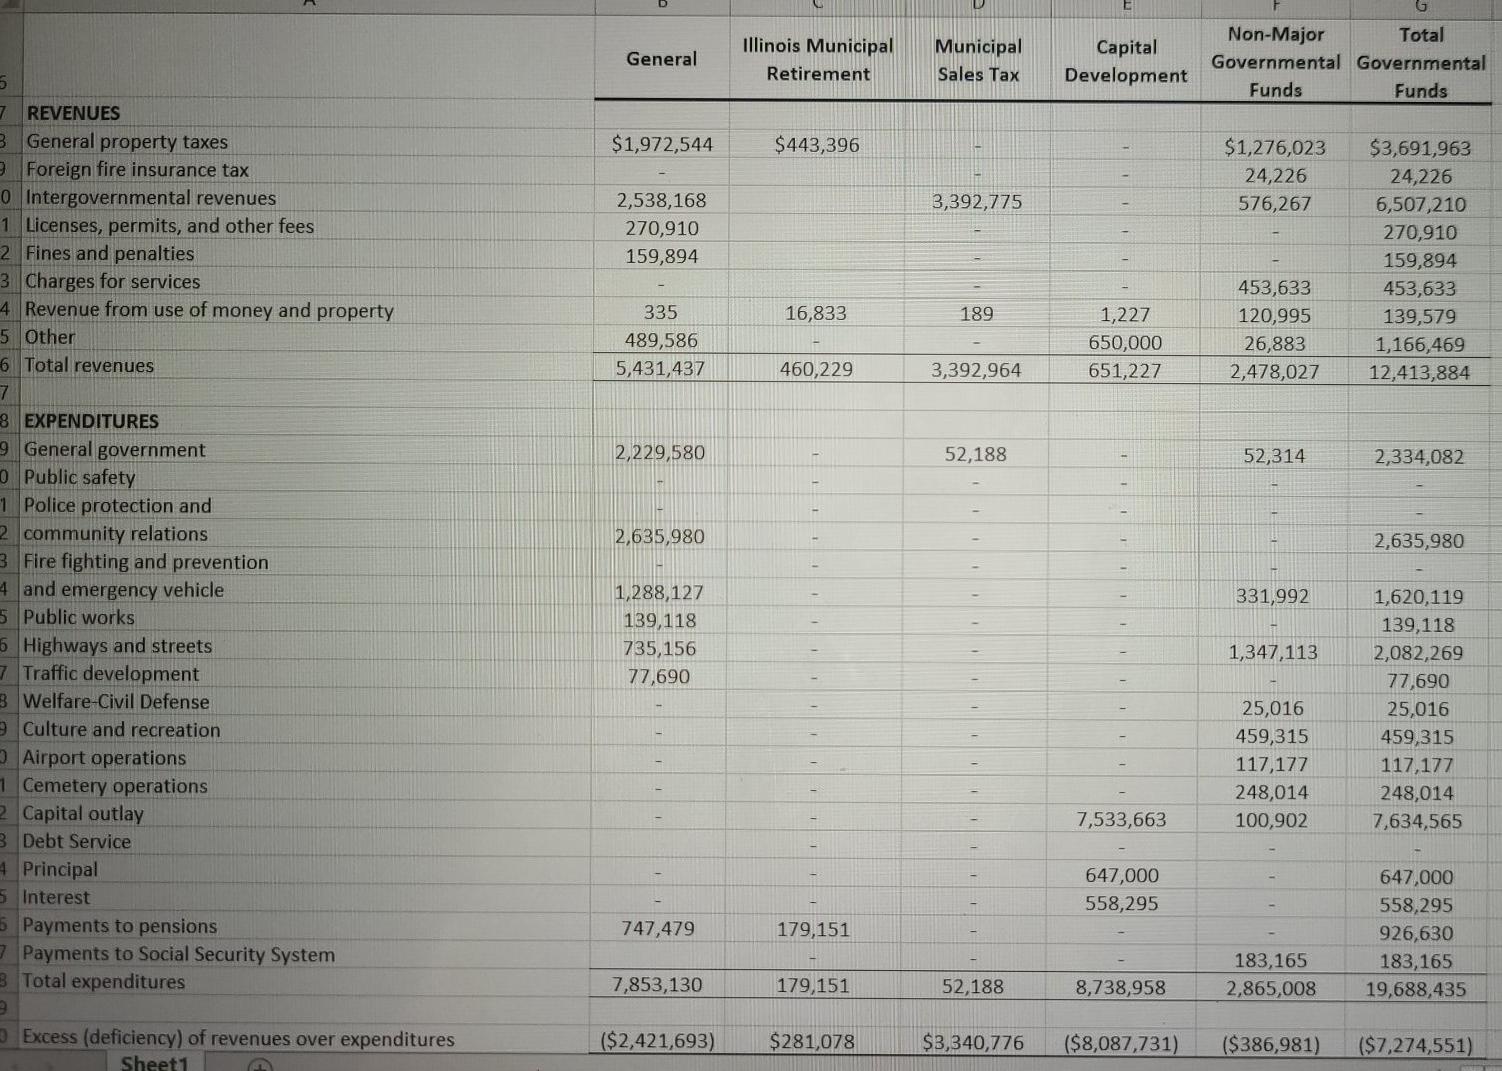
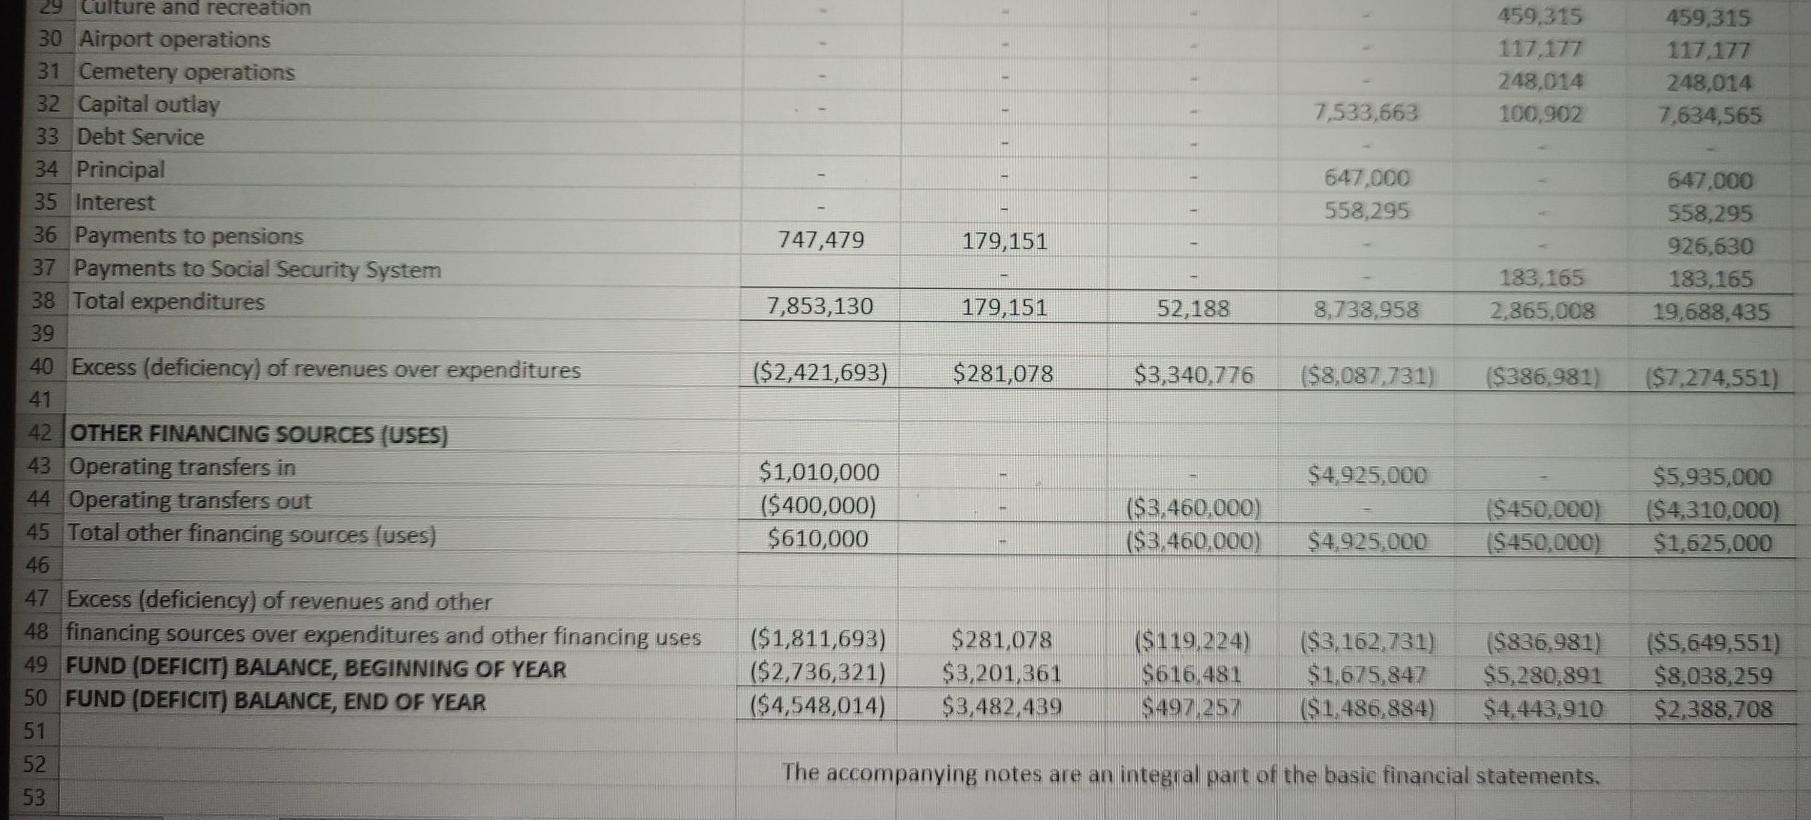
General Illinois Municipal Retirement Municipal Sales Tax Capital Development Non-Major Total Governmental Governmental Funds Funds $1,972,544 $443,396 $1,276,023 24,226 576,267 3,392,775 2,538,168 270,910 159,894 $3,691,963 24,226 6,507,210 270,910 159,894 453,633 139,579 1,166,469 12,413,884 16,833 189 335 489,586 5,431,437 1,227 650,000 651,227 453,633 120,995 26,883 2,478,027 460,229 3,392,964 2,229,580 52,188 52,314 2,334,082 2,635,980 7 REVENUES 3 General property taxes Foreign fire insurance tax 0 Intergovernmental revenues 1 Licenses, permits, and other fees 2 Fines and penalties 3 Charges for services 4 Revenue from use of money and property 5 Other 6 Total revenues 7 8 EXPENDITURES 9 General government O Public safety 1 Police protection and 2 community relations 3 Fire fighting and prevention 4 and emergency vehicle 5 Public works 6 Highways and streets 7 Traffic development 8 Welfare-Civil Defense 9 Culture and recreation Airport operations 1 Cemetery operations 2 Capital outlay B Debt Service 4 Principal 5 Interest 5 Payments to pensions 7 Payments to Social Security System 3 Total expenditures 2,635,980 331,992 1,288,127 139,118 735,156 77,690 1,347,113 25,016 459,315 117,177 248,014 100,902 1,620,119 139,118 2,082,269 77,690 25,016 459,315 117,177 248,014 7,634,565 7,533,663 647,000 558,295 747,479 179,151 647,000 558,295 926,630 183,165 19,688,435 7,853,130 183,165 2,865,008 179,151 52,188 8,738,958 Excess (deficiency) of revenues over expenditures Sheet1 ($2,421,693) $281,078 $3,340,776 ($8,087,731) ($386,981) ($7,274,551) 459,315 117,177 248,014 100,902 459,315 117,177 248,014 7.634,565 7,533,663 647,000 558,295 747,479 179,151 647,000 558,295 926.630 183.165 19,688,435 183.165 2.865,008 7,853,130 179,151 52,188 8,738,958 ($2,421,693) $281,078 $3,340,776 ($8,087,731) ($386,981) ($7,274,551) 29 Culture and recreation 30 Airport operations 31 Cemetery operations 32 Capital outlay 33 Debt Service 34 Principal 35 Interest 36 Payments to pensions 37 Payments to Social Security System 38 Total expenditures 39 40 Excess (deficiency) of revenues over expenditures 41 42 OTHER FINANCING SOURCES (USES) 43 Operating transfers in 44 Operating transfers out 45 Total other financing sources (uses) 46 47 Excess (deficiency) of revenues and other 48 financing sources over expenditures and other financing uses 49 FUND (DEFICIT) BALANCE, BEGINNING OF YEAR 50 FUND (DEFICIT) BALANCE, END OF YEAR 51 52 53 $4.925,000 $1,010,000 ($ 400,000) $610,000 ($3,460,000) ($3,460,000) ($450,000) ($450,000) $5,935,000 ($4,310,000) $1,625,000 $4.925,000 ($1,811,693) ($ 2,736,321) ($4,548,014) $281,078 $3,201,361 $3,482,439 ($ 119,224) $616,481 $497,257 ($3,162,731) $1,675,847 ($1,486,884) ($836,981) $5,280,891 $4,443,910 ($5,649,551) $8,038,259 $2,388,708 The accompanying notes are an integral part of the basic financial statements, General Illinois Municipal Retirement Municipal Sales Tax Capital Development Non-Major Total Governmental Governmental Funds Funds $1,972,544 $443,396 $1,276,023 24,226 576,267 3,392,775 2,538,168 270,910 159,894 $3,691,963 24,226 6,507,210 270,910 159,894 453,633 139,579 1,166,469 12,413,884 16,833 189 335 489,586 5,431,437 1,227 650,000 651,227 453,633 120,995 26,883 2,478,027 460,229 3,392,964 2,229,580 52,188 52,314 2,334,082 2,635,980 7 REVENUES 3 General property taxes Foreign fire insurance tax 0 Intergovernmental revenues 1 Licenses, permits, and other fees 2 Fines and penalties 3 Charges for services 4 Revenue from use of money and property 5 Other 6 Total revenues 7 8 EXPENDITURES 9 General government O Public safety 1 Police protection and 2 community relations 3 Fire fighting and prevention 4 and emergency vehicle 5 Public works 6 Highways and streets 7 Traffic development 8 Welfare-Civil Defense 9 Culture and recreation Airport operations 1 Cemetery operations 2 Capital outlay B Debt Service 4 Principal 5 Interest 5 Payments to pensions 7 Payments to Social Security System 3 Total expenditures 2,635,980 331,992 1,288,127 139,118 735,156 77,690 1,347,113 25,016 459,315 117,177 248,014 100,902 1,620,119 139,118 2,082,269 77,690 25,016 459,315 117,177 248,014 7,634,565 7,533,663 647,000 558,295 747,479 179,151 647,000 558,295 926,630 183,165 19,688,435 7,853,130 183,165 2,865,008 179,151 52,188 8,738,958 Excess (deficiency) of revenues over expenditures Sheet1 ($2,421,693) $281,078 $3,340,776 ($8,087,731) ($386,981) ($7,274,551) 459,315 117,177 248,014 100,902 459,315 117,177 248,014 7.634,565 7,533,663 647,000 558,295 747,479 179,151 647,000 558,295 926.630 183.165 19,688,435 183.165 2.865,008 7,853,130 179,151 52,188 8,738,958 ($2,421,693) $281,078 $3,340,776 ($8,087,731) ($386,981) ($7,274,551) 29 Culture and recreation 30 Airport operations 31 Cemetery operations 32 Capital outlay 33 Debt Service 34 Principal 35 Interest 36 Payments to pensions 37 Payments to Social Security System 38 Total expenditures 39 40 Excess (deficiency) of revenues over expenditures 41 42 OTHER FINANCING SOURCES (USES) 43 Operating transfers in 44 Operating transfers out 45 Total other financing sources (uses) 46 47 Excess (deficiency) of revenues and other 48 financing sources over expenditures and other financing uses 49 FUND (DEFICIT) BALANCE, BEGINNING OF YEAR 50 FUND (DEFICIT) BALANCE, END OF YEAR 51 52 53 $4.925,000 $1,010,000 ($ 400,000) $610,000 ($3,460,000) ($3,460,000) ($450,000) ($450,000) $5,935,000 ($4,310,000) $1,625,000 $4.925,000 ($1,811,693) ($ 2,736,321) ($4,548,014) $281,078 $3,201,361 $3,482,439 ($ 119,224) $616,481 $497,257 ($3,162,731) $1,675,847 ($1,486,884) ($836,981) $5,280,891 $4,443,910 ($5,649,551) $8,038,259 $2,388,708 The accompanying notes are an integral part of the basic financial statements
Step by Step Solution
There are 3 Steps involved in it

Get step-by-step solutions from verified subject matter experts