

Question: Calculate marginal revenue using the table, graph the marginal cost, demand, and marginal revenue curves, and answer four questions about output in a monopolistic catfish
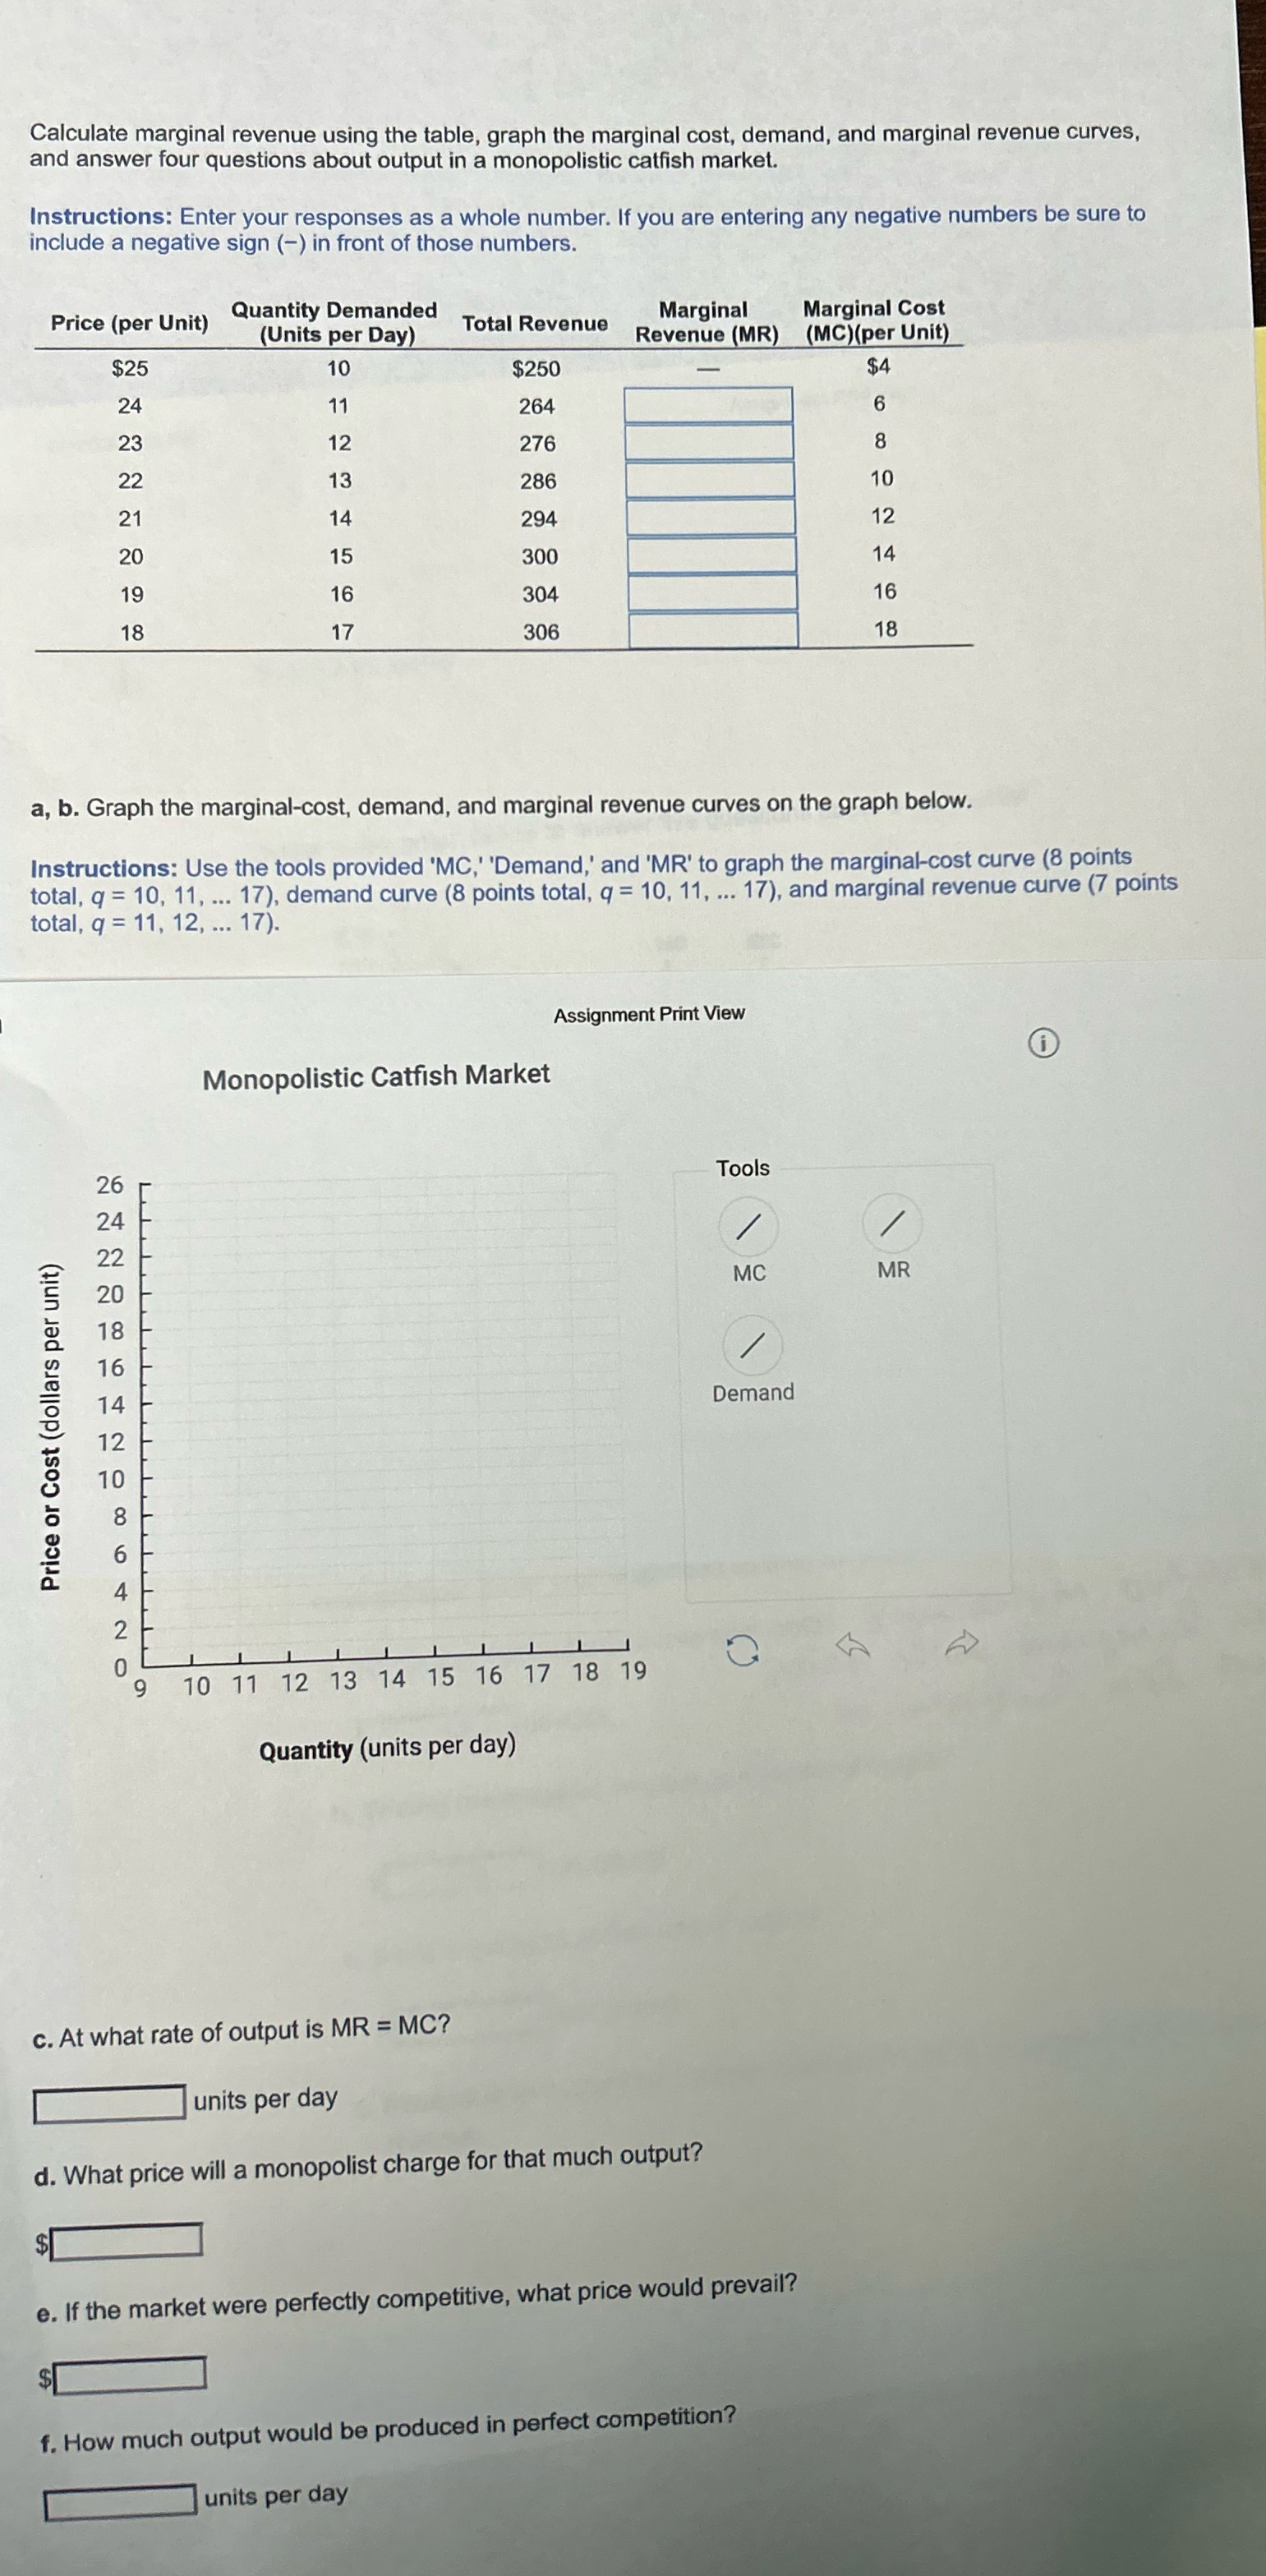
Calculate marginal revenue using the table, graph the marginal cost, demand, and marginal revenue curves, and answer four questions about output in a monopolistic catfish market. Instructions: Enter your responses as a whole number. If you are entering any negative numbers be sure to include a negative sign (-) in front of those numbers. Price (per Unit) Quantity Demanded (Units per Day) Total Revenue Marginal Marginal Cost Revenue (MR) (MC)(per Unit) $25 10 $250 $4 24 11 264 23 12 276 8 22 13 286 10 21 14 294 12 20 15 300 14 19 16 304 16 18 17 306 18 a, b. Graph the marginal-cost, demand, and marginal revenue curves on the graph below. Instructions: Use the tools provided 'MC,' 'Demand,' and 'MR' to graph the marginal-cost curve (8 points total, q = 10, 11, ... 17), demand curve (8 points total, q = 10, 11, ... 17), and marginal revenue curve (7 points total, q = 11, 12, ... 17). Assignment Print View Monopolistic Catfish Market Tools MC MR Demand Price or Cost (dollars per unit) 10 11 12 13 14 15 16 17 18 19 Quantity (units per day) c. At what rate of output is MR = MC? units per day d. What price will a monopolist charge for that much output? $ e. If the market were perfectly competitive, what price would prevail? $ f. How much output would be produced in perfect competition? units per day
Step by Step Solution
There are 3 Steps involved in it

Get step-by-step solutions from verified subject matter experts