

Question: Calculate Return on Common Equity and Return on Equity for 2019. (Show work) Dec. 31, 2019 Dec. 31, 2018 $ 40,406 $ 31,315 214,915 192,026
Calculate Return on Common Equity and Return on Equity for 2019. (Show work)
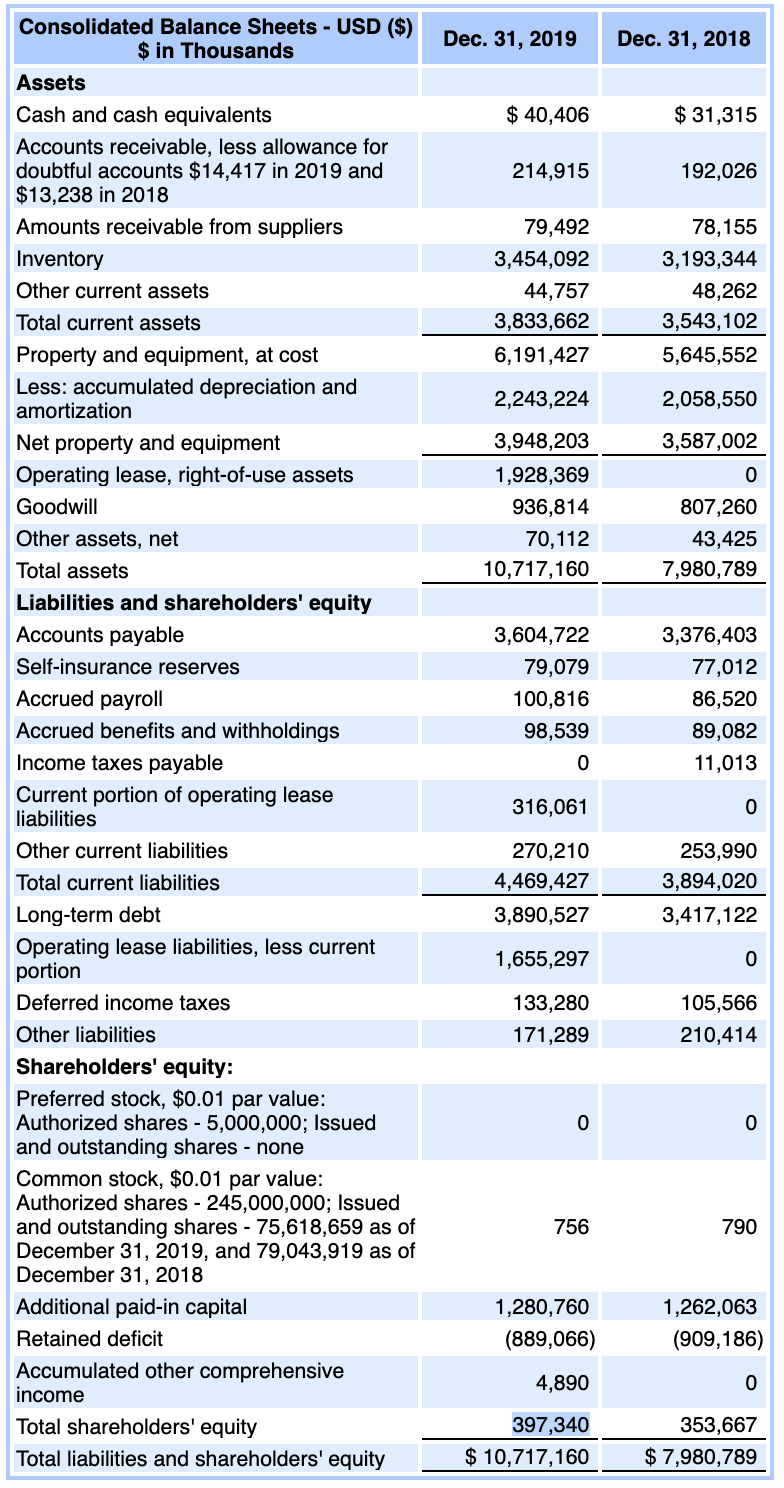
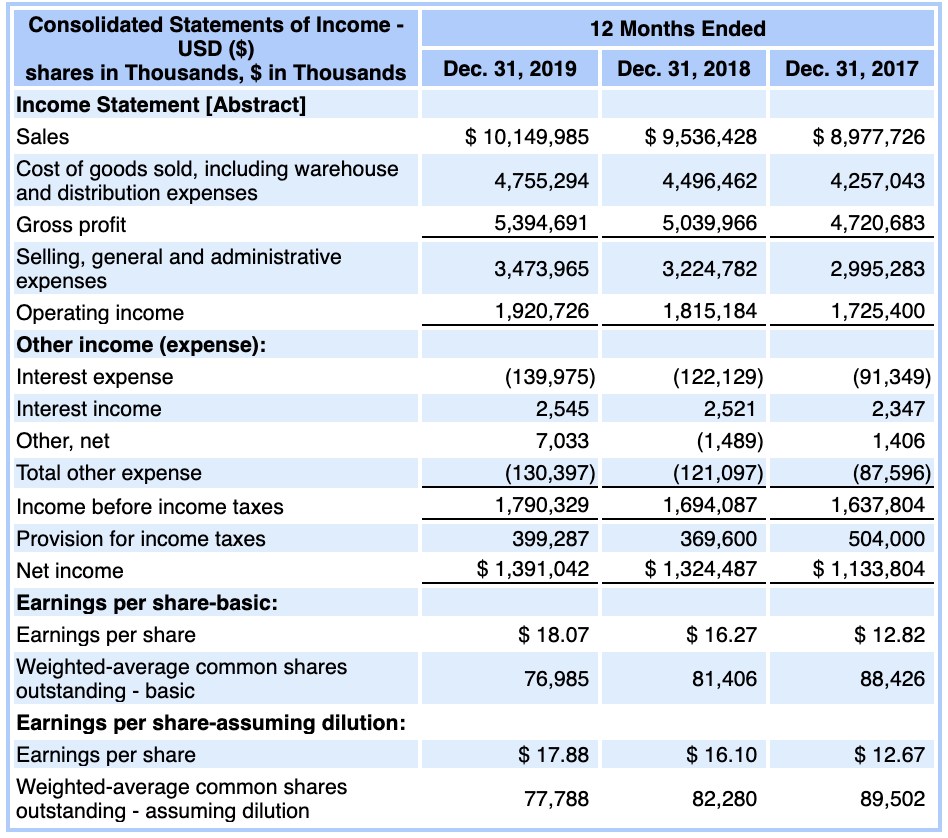
Dec. 31, 2019 Dec. 31, 2018 $ 40,406 $ 31,315 214,915 192,026 79,492 3,454,092 44,757 3,833,662 6,191,427 78,155 3,193,344 48,262 3,543,102 5,645,552 2,243,224 2,058,550 3,587,002 0 3,948,203 1,928,369 936,814 70,112 10,717,160 807,260 43,425 7,980,789 3,604,722 79,079 100,816 98,539 Consolidated Balance Sheets - USD ($) $ in Thousands Assets Cash and cash equivalents Accounts receivable, less allowance for doubtful accounts $14,417 in 2019 and $13,238 in 2018 Amounts receivable from suppliers Inventory Other current assets Total current assets Property and equipment, at cost Less: accumulated depreciation and amortization Net property and equipment Operating lease, right-of-use assets Goodwill Other assets, net Total assets Liabilities and shareholders' equity Accounts payable Self-insurance reserves Accrued payroll Accrued benefits and withholdings Income taxes payable Current portion of operating lease liabilities Other current liabilities Total current liabilities Long-term debt Operating lease liabilities, less current portion Deferred income taxes Other liabilities Shareholders' equity: Preferred stock, $0.01 par value: Authorized shares - 5,000,000; Issued and outstanding shares - none Common stock, $0.01 par value: Authorized shares - 245,000,000; Issued and outstanding shares - 75,618,659 as of December 31, 2019, and 79,043,919 as of December 31, 2018 Additional paid-in capital Retained deficit Accumulated other comprehensive income Total shareholders' equity Total liabilities and shareholders' equity 3,376,403 77,012 86,520 89,082 11,013 0 316,061 0 270,210 4,469,427 3,890,527 253,990 3,894,020 3,417,122 1,655,297 0 133,280 171,289 105,566 210,414 0 0 756 790 1,280,760 (889,066) 1,262,063 (909,186) 4,890 0 397,340 $ 10,717,160 353,667 $ 7,980,789 12 Months Ended Dec. 31, 2019 Dec. 31, 2018 Dec. 31, 2017 $ 10,149,985 $ 9,536,428 $ 8,977,726 4,755,294 4,496,462 4,257,043 5,394,691 5,039,966 4,720,683 3,473,965 3,224,782 2,995,283 1,920,726 1,815,184 1,725,400 Consolidated Statements of Income - USD ($) shares in Thousands, $ in Thousands Income Statement [Abstract] Sales Cost of goods sold, including warehouse and distribution expenses Gross profit Selling, general and administrative expenses Operating income Other income (expense): Interest expense Interest income Other, net Total other expense Income before income taxes Provision for income taxes Net income Earnings per share-basic: Earnings per share Weighted average common shares outstanding - basic Earnings per share-assuming dilution: Earnings per share Weighted average common shares outstanding - assuming dilution (139,975) 2,545 7,033 (130,397) 1,790,329 399,287 $ 1,391,042 (122,129) 2,521 (1,489) (121,097) 1,694,087 369,600 $ 1,324,487 (91,349) 2,347 1,406 (87,596) 1,637,804 504,000 $ 1,133,804 $ 18.07 $ 16.27 $ 12.82 76,985 81,406 88,426 $ 17.88 $ 16.10 $ 12.67 77,788 82,280 89,502
Step by Step Solution
There are 3 Steps involved in it

Get step-by-step solutions from verified subject matter experts