

Question: Calculate Select Ratios - Excel FILE HOME INSERT REVIEW VIEW PAGE LAYOUT FORMULAS DATA o Connections Properties Existing Refresh Connections All Edit Links Connections Cear
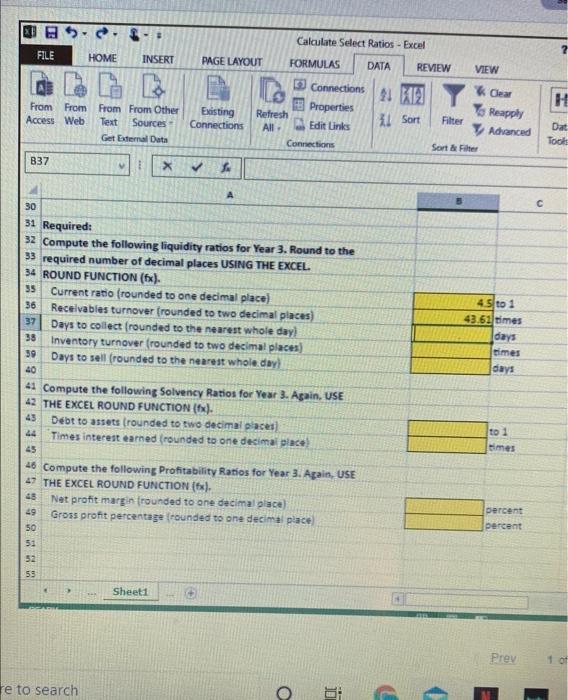
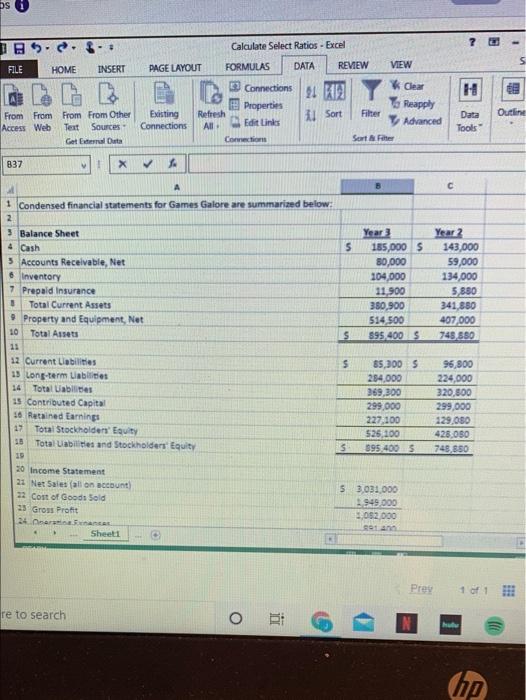
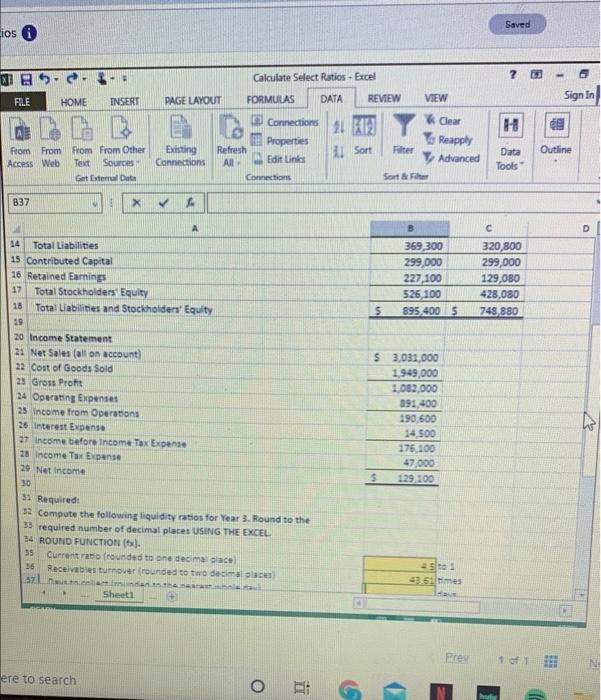
Calculate Select Ratios - Excel FILE HOME INSERT REVIEW VIEW PAGE LAYOUT FORMULAS DATA o Connections Properties Existing Refresh Connections All Edit Links Connections Cear Reapply From From From From Other Access Web Text Sources Get External Data H 31 Sort Filter Advanced Dat Took Sort & Filter B37 X A 30 31 Required: 32 Compute the following liquidity ratios for Year 3. Round to the 33 required number of decimal places USING THE EXCEL. 34 ROUND FUNCTION (6x). Current ratio (rounded to one decimal place) 36 Receivables turnover (rounded to two decimal places) Days to collect (rounded to the nearest whole day! 38 Inventory turnover (rounded to two decimal places) 39 Days to sell (rounded to the nearest whole day 40 41 Compute the following Solvency Ratios for Year 3. Again, USE 42 THE EXCEL ROUND FUNCTION (1x). Debt to assets (rounded to two decimal places 44 Times interest earned (rounded to one decimal place 45 46 Compute the following Profitability Ratios for Year 3. Again, USE 47 THE EXCEL ROUND FUNCTION (6x). Net profit margin frounded to one decimal place) 49 Gross profit percentage (rounded to one decimal place 50 4.5 to 1 43.61 mes days imes days M868 5 & 6ES8%#*WWW smes percent percent Sheet Prev 1 of re to search o DS 7 14 Calculate Select Ratios - Excel s FILE HOME INSERT PAGE LAYOUT FORMULAS VIEW DATA REVIEW * Clear Rapply 11 12 Y Sort Connections Properties Refresh All Edit Links Connections Filter Outline From From From From Other Access Web Text Sources Get Excel Data Existing Connections Advanced Data Tools Sort & Fitter 837 X 5 Year 3 155,000 $ 80,000 104,000 11.900 380,900 514.500 595 400 5 Year 2 143,000 59,000 134,000 5,880 341,880 407 000 749.550 5 A 1 Condensed financial statements for Games Galore are summarized below: 2 3 Balance Sheet 4 Cash 3 Accounts Receivable, Net 6 Inventory 7 Prepaid Insurance Total Current Assets Property and Equipment, Net 10 Total Assets 11 12 Current Liabilities 13 long-term Uables 14 Total Uabiles 15 Contributed Capital 16 Retained Earnings 17 Total Stockholders' Equity 10 Total abilities and Stockholders' Equity 19 20 Income Statement 21 Net Sales (all on account 22 Cost of Goods Sold 25 Gross Profit 24 Oras Sheet1 $ 85,000 $ 284,000 369,300 299,000 227,100 $25.100 $95.400 5 96,800 224,000 320,800 299,000 129080 428.000 745.850 5 5 3.031 000 949.000 1.052.000 91 and Prey 1 of 1 re to search O BI op Saved Lios WA Calculate Select Ratios - Excel FILE INSERT HOME REVIEW Sign In VIEW 31412 PAGE LAYOUT FORMULAS DATA Connections Properties Existing Refresh Connections All Edit Links Connections Clear Reapply i Sort Filter Outline From From From From Other Access Web Text Sources Get Estemul Data Advanced Data Tools Sort & Filter B37 X A D 369,300 299,000 227,100 525 100 895.400$ 320,800 299,000 129,080 428,080 749,880 $ 14 Total Liabilities 15 Contributed Capital 16 Retained Earnings 17 Total Stockholders' Equity 18 Total Liabilities and Stockholders' Equity 19 20 Income Statement 21 Net Sales (all on account) 22 Cost of Goods Sold 25 Gross Profit 24 Operating Expenses 25 income from Operations 26. Interest Expense 27 Income before Income Tax Expense 28 Income Tax Expense 20 Net Income 30 31 Required: 32 Compute the following liquidity ratios for Year 3. Round to the 35 required number of decimal places USING THE EXCEL 34 ROUND FUNCTION() 35 Current ratio rounded to one dei mesiace 36 Receivables turnover (rounded to two decimasiace $ 3,031,000 1,949,000 1,082,000 891,400 190.600 14 500 175.100 47.000 5 129 100 av sto 33.5mes Sheet Pre 1 of 1 ere to search o HI hy
Step by Step Solution
There are 3 Steps involved in it

Get step-by-step solutions from verified subject matter experts