

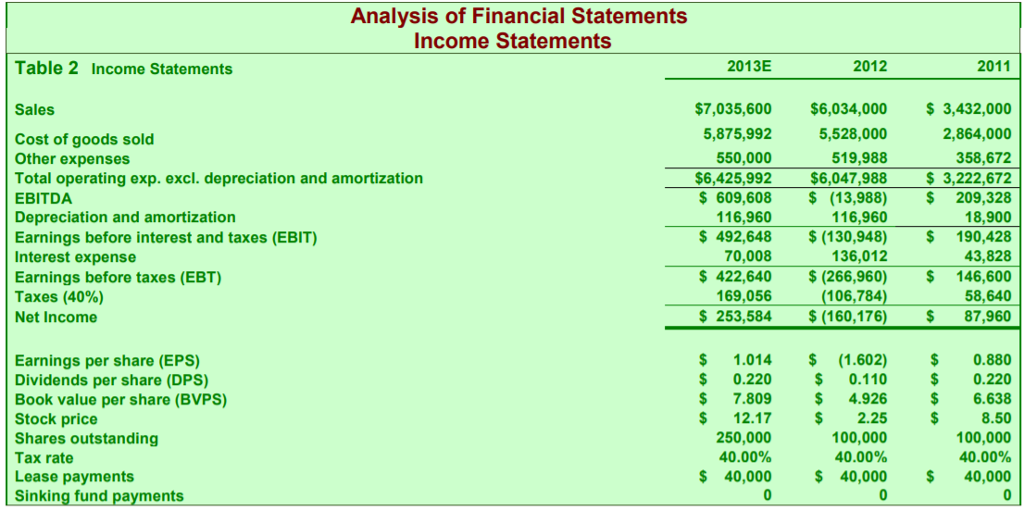
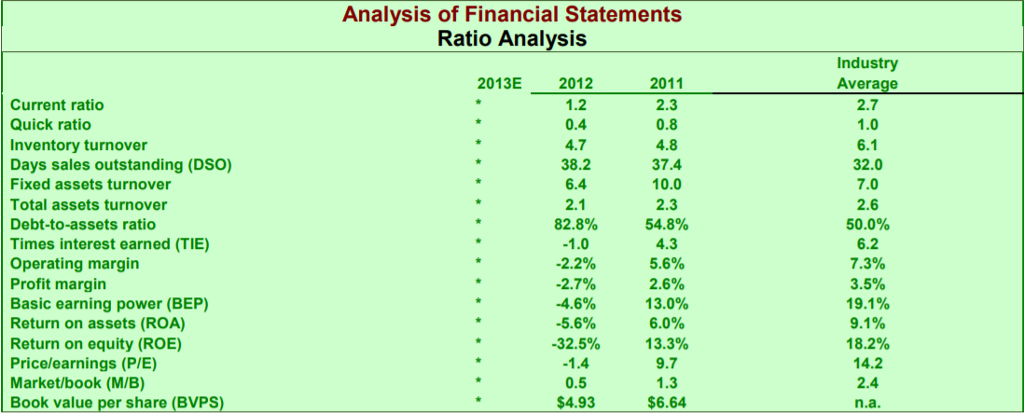
Question: Calculate the 2013 operating margin, profit margin, basic earning power (BEP), return on assets (ROA), and return on equity (ROE). Analysis of Financial Statements Balance
Calculate the 2013 operating margin, profit margin, basic earning power (BEP), return on assets (ROA), and return on equity (ROE).
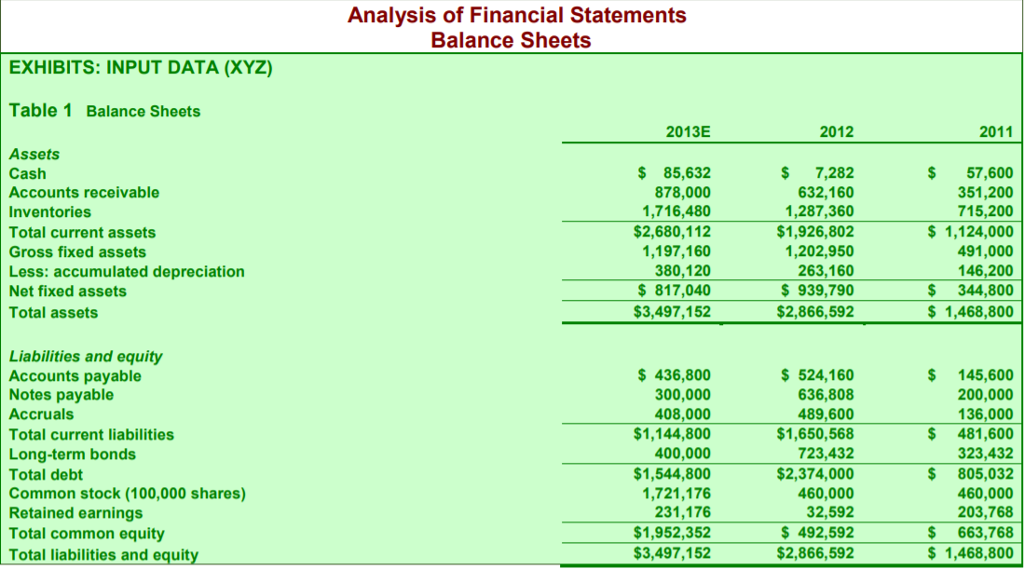
Analysis of Financial Statements Balance Sheets EXHIBITS: INPUT DATA (XYZ) Table 1 Balance Sheets 2013E 2012 2011 Assets Cash Accounts receivable Inventories Total current assets Gross fixed assets Less: accumulated depreciation Net fixed assets Total assets $ 85,632 878,000 1,716,480 $2,680,112 1,197,160 380,120 $817,040 $3,497,152 $ 7,282 632,160 1,287,360 $1,926,802 1,202,950 263,160 939,790 $2,866,592 $ 57,600 351,200 715,200 $ 1,124,000 491,000 146,200 $ 344,800 $ 1,468,800 Liabilities and equity $ 436,800 300,000 408,000 $1,144,800 400,000 $1,544,800 1,721,176 231,176 $1,952,352 $3,497,152 $524,160 636,808 489,600 $1,650,568 723,432 $2,374,000 460,000 32,592 $ 492,592 $2,866,592 $ 145,600 200,000 136,000 $ 481,600 323,432 $ 805,032 460,000 203,768 $ 663,768 $1,468,800 Accounts payable Notes payable Accruals Total current liabilities Long-term bonds Total debt Common stock (100,000 shares) Retained earnings Total common equity Total liabilities and equit
Step by Step Solution
There are 3 Steps involved in it

Get step-by-step solutions from verified subject matter experts