

Question: Calculate the average aggregate inventory . The data in the table below shows the average inventory levels. Conclude with advice as to whether the company
Calculate the average aggregate inventory . The data in the table below shows the average inventory levels. Conclude with advice as to whether the company will be able to provide a constant flow of meals to the communities where the outlets operate if the demand for burgers (beef and chicken) and chips is 18 000 units, and is 3 400 for chicken nuggets. Conclude with advice that you will management. Also calculate the weeks of supply and inventory turnover, and write a brief report on whether the inventory levels are sufficient and the management thereof efficient.
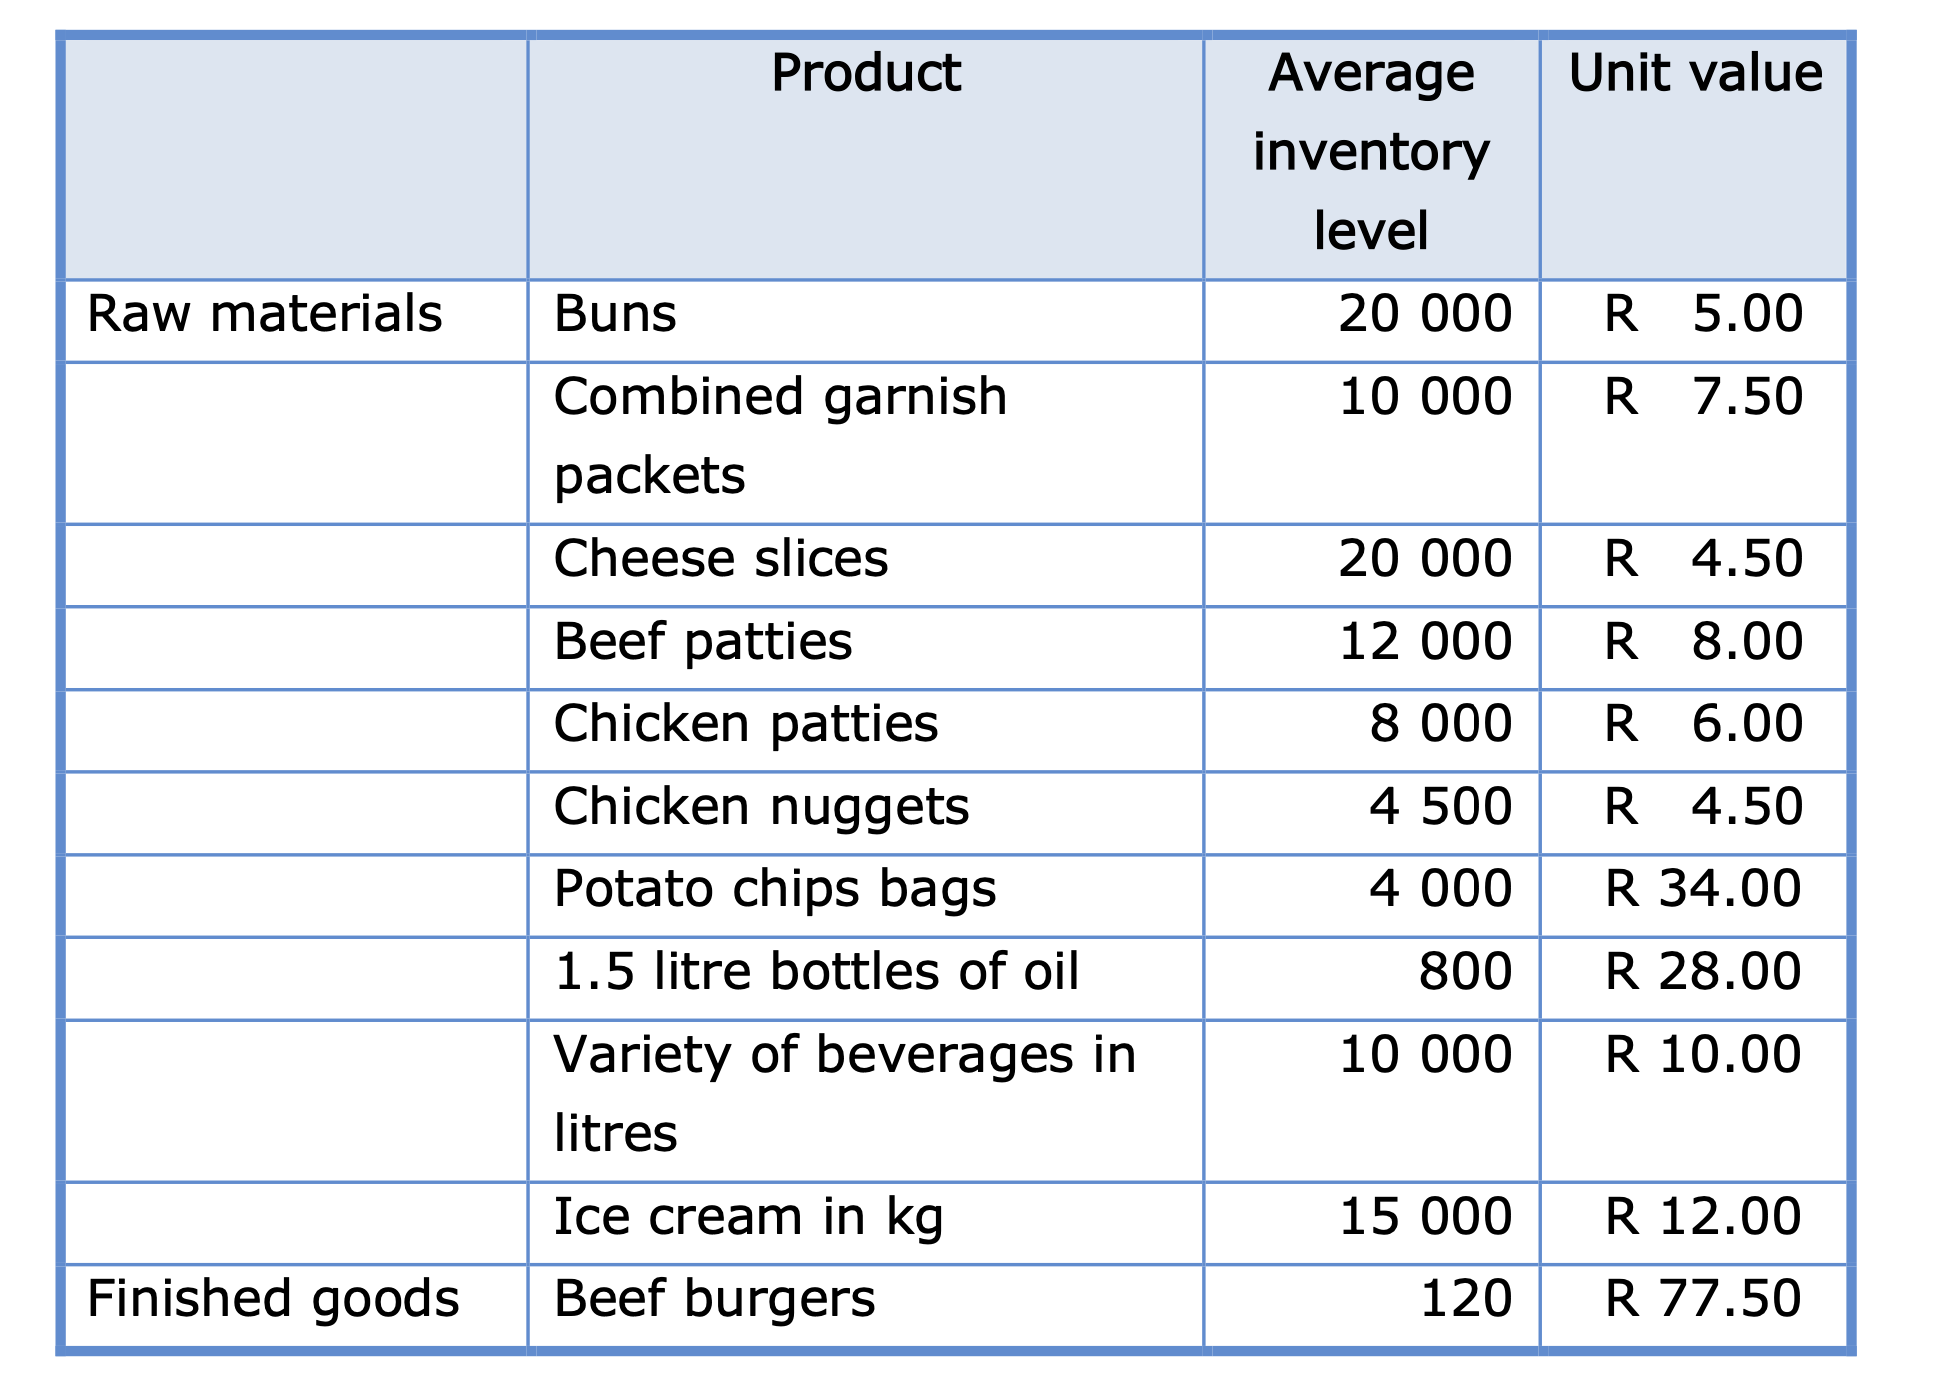
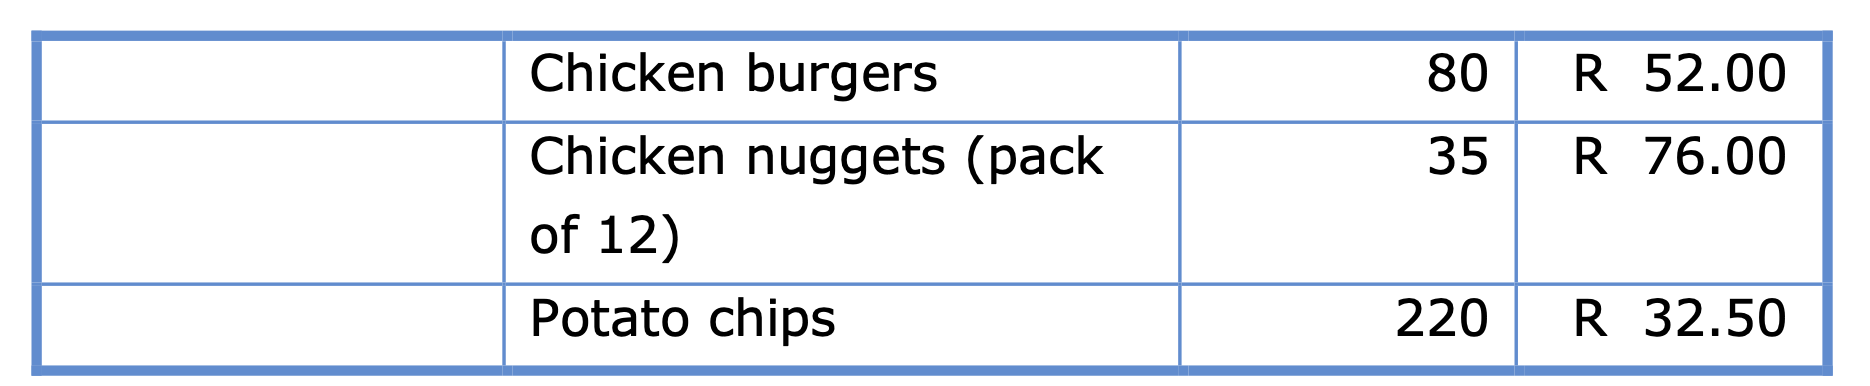
\begin{tabular}{|l|l|r|r|} \hline & \multicolumn{1}{|c|}{ Product } & Averageinventorylevel & Unit value \\ \hline Raw materials & Buns & 20000 & R5.00 \\ \hline & Combinedgarnishpackets & 10000 & R7.50 \\ \hline & Cheese slices & 20000 & R4.50 \\ \hline & Beef patties & 12000 & R8.00 \\ \hline & Chicken patties & 8000 & R6.00 \\ \hline & Chicken nuggets & 4500 & R4.50 \\ \hline & Potato chips bags & 4000 & R34.00 \\ \hline & 1.5 litre bottles of oil & 800 & R28.00 \\ \hline & Varietyofbeveragesinlitres & 10000 & R10.00 \\ \hline & Ice cream in kg & 15000 & R12.00 \\ \hline Finished goods & Beef burgers & 120 & R77.50 \\ \hline \end{tabular} \begin{tabular}{|l|l|r|r|} \hline & Chicken burgers & 80 & R 52.00 \\ \hline & Chickennuggets(packof12) & 35 & R76.00 \\ \hline & Potato chips & 220 & R 32.50 \\ \hline \end{tabular}
Step by Step Solution
There are 3 Steps involved in it

Get step-by-step solutions from verified subject matter experts