

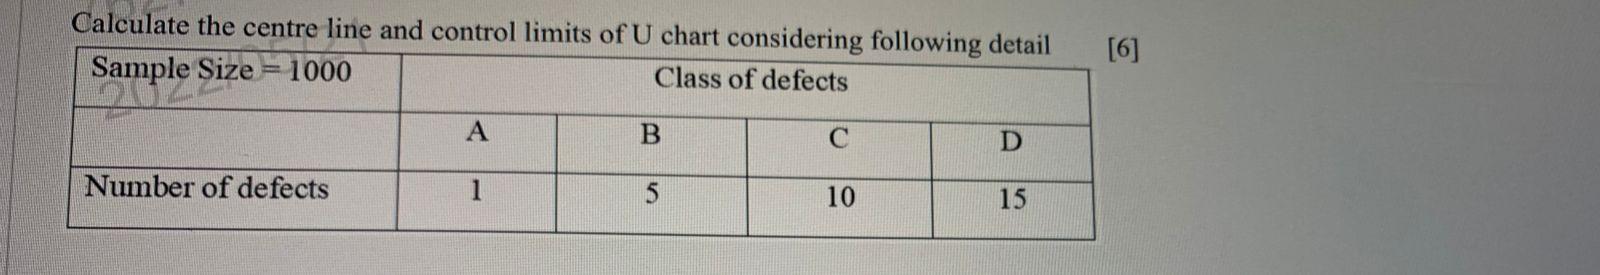
Question: Calculate the centre line and control limits of U chart considering following detail [6] Sample Size = 1000 mple Siz Class of defects A B
Step by Step Solution
There are 3 Steps involved in it
1 Expert Approved Answer
Step: 1 Unlock

Question Has Been Solved by an Expert!
Get step-by-step solutions from verified subject matter experts
Step: 2 Unlock
Step: 3 Unlock