

Calculate the company's current ratio for both the recent year and the prior year. Show your...
Fantastic news! We've Found the answer you've been seeking!
Question:
Transcribed Image Text:
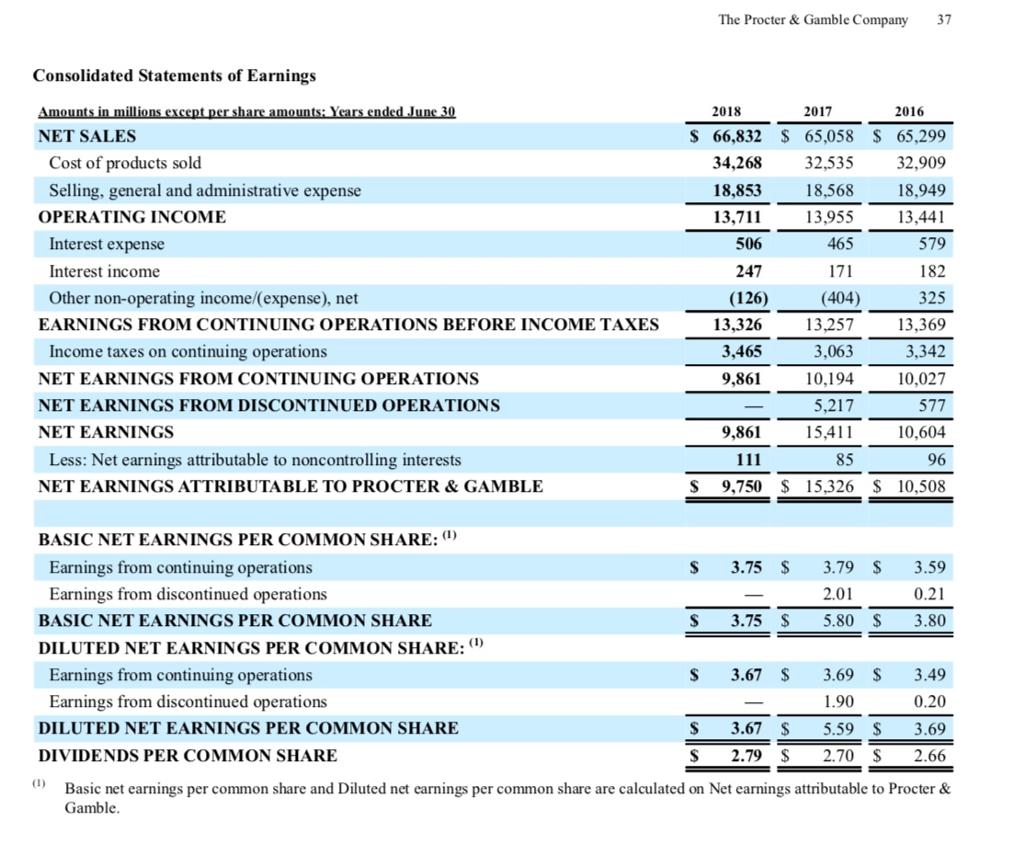
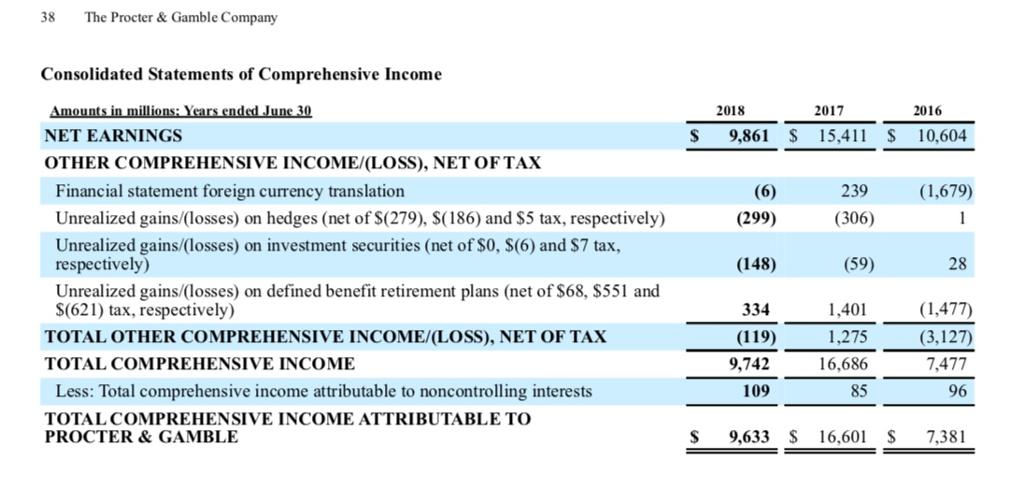
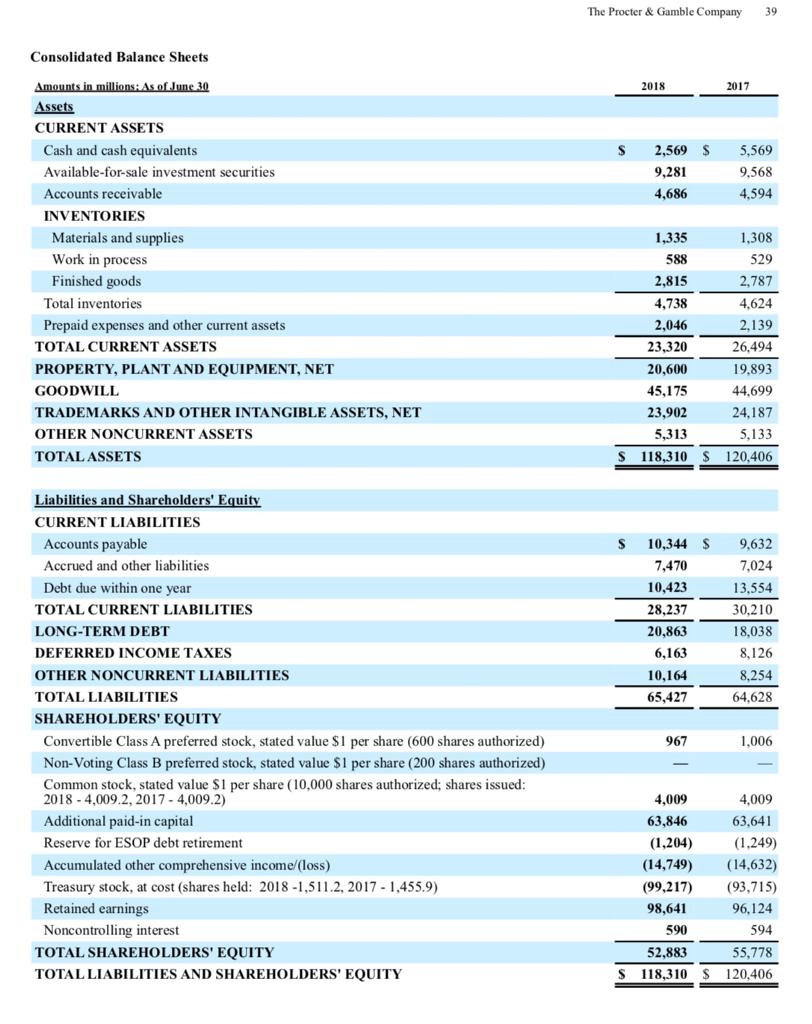
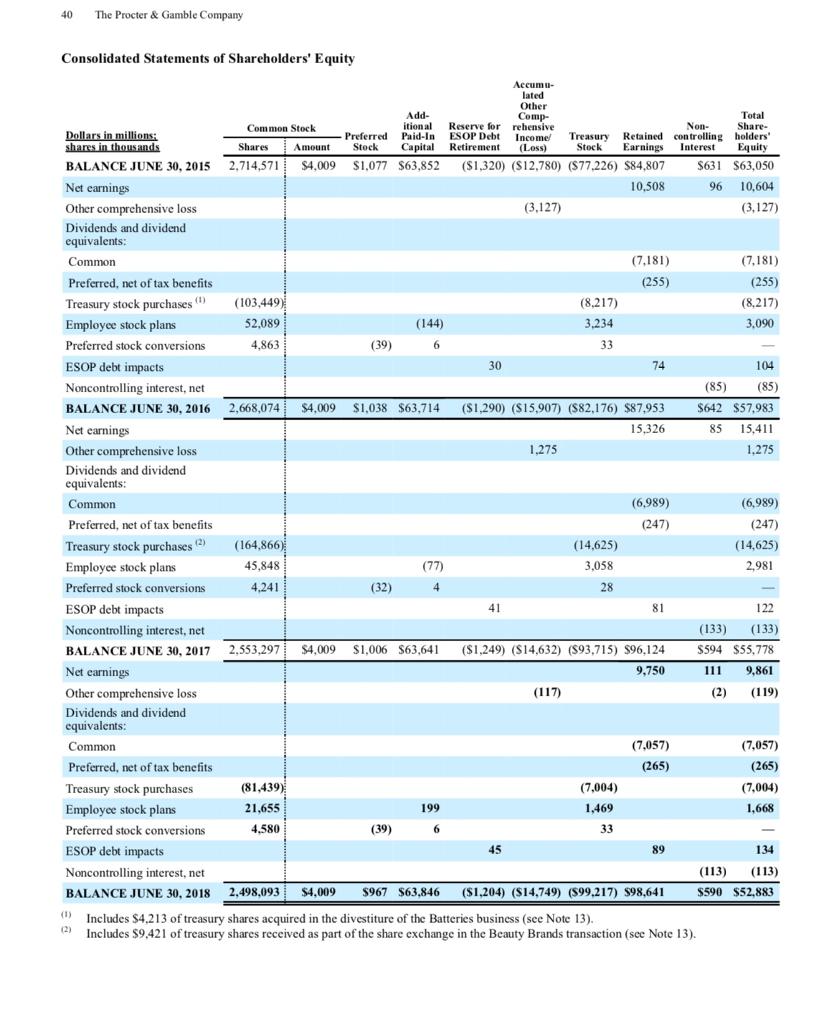
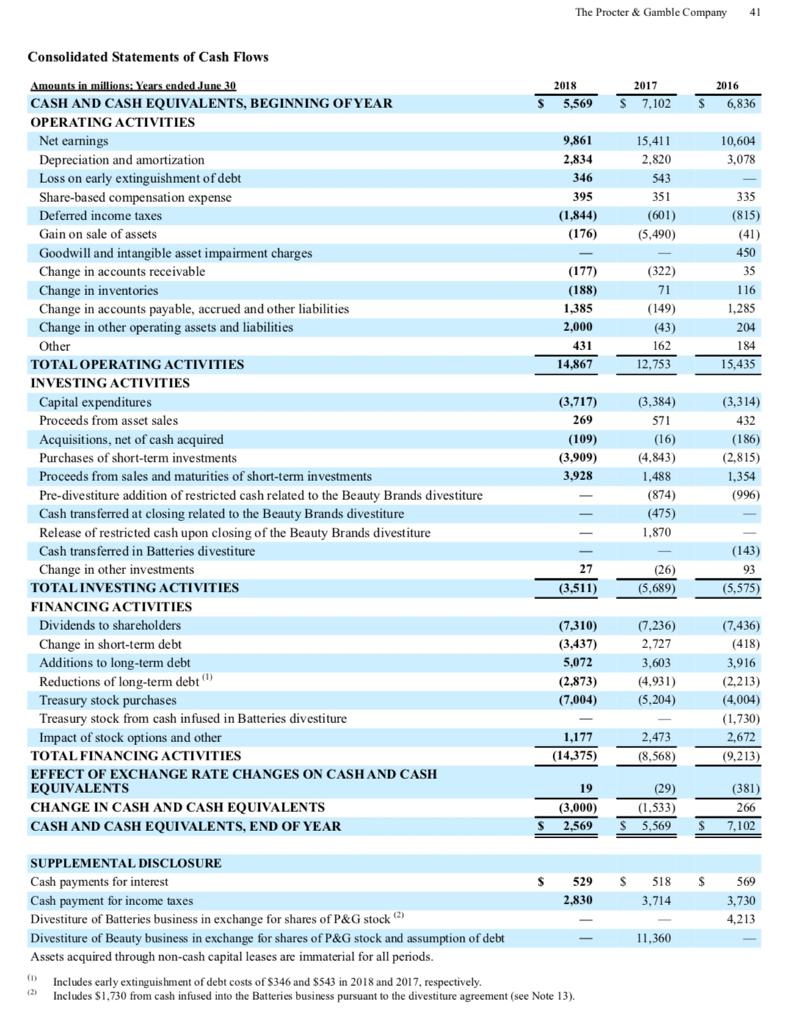
Calculate the company's current ratio for both the recent year and the prior year. Show your computations. Write the textbook formula here: Recent year: Prior year: Explain what information this ratio provides (define), and what the results mean to this company. Use complete sentences and your own words. Compare the two, has the current ratio improved? Consolidated Statements of Earnings Amounts in millions except per share amounts: Years ended June 30 NET SALES Cost of products sold Selling, general and administrative expense OPERATING INCOME Interest expense Interest income Other non-operating income/(expense), net EARNINGS FROM CONTINUING OPERATIONS BEFORE INCOME TAXES Income taxes on continuing operations NET EARNINGS FROM CONTINUING OPERATIONS NET EARNINGS FROM DISCONTINUED OPERATIONS NET EARNINGS Less: Net earnings attributable to noncontrolling interests NET EARNINGS ATTRIBUTABLE TO PROCTER & GAMBLE BASIC NET EARNINGS PER COMMON SHARE: () Earnings from continuing operations Earnings from discontinued operations BASIC NET EARNINGS PER COMMON SHARE DILUTED NET EARNINGS PER COMMON SHARE: () Earnings from continuing operations Earnings from discontinued operations DILUTED NET EARNINGS PER COMMON SHARE DIVIDENDS PER COMMON SHARE (1) 2018 2017 S 66,832 $ 65,058 34,268 32,535 The Procter & Gamble Company $ 18,568 13,955 465 171 (404) 13,257 3,063 10,194 5,217 9,861 15,411 111 85 S 9,750 $ 15,326 $ 10,508 $ 18,853 13,711 506 247 (126) S 3.75 S S 13,326 3,465 9,861 $ 3.75 $ 3.67 $ 2016 $ 65,299 32,909 18,949 13,441 579 37 3.79 S 2.01 5.80 $ 3.69 $ 1.90 182 325 13,369 3,342 10,027 577 10,604 96 3.59 0.21 3.80 3.49 0.20 3.67 S 5.59 $ 3.69 2.79 $ 2.70 $ 2.66 Basic net earnings per common share and Diluted net earnings per common share are calculated on Net earnings attributable to Procter & Gamble. 38 The Procter & Gamble Company Consolidated Statements of Comprehensive Income Amounts in millions: Years ended June 30 NET EARNINGS OTHER COMPREHENSIVE INCOME/(LOSS), NET OF TAX Financial statement foreign currency translation Unrealized gains/(losses) on hedges (net of $(279), S(186) and $5 tax, respectively) Unrealized gains/(losses) on investment securities (net of $0, $(6) and $7 tax, respectively) Unrealized gains/(losses) on defined benefit retirement plans (net of $68, $551 and $(621) tax, respectively) TOTAL OTHER COMPREHENSIVE INCOME/(LOSS), NET OF TAX TOTAL COMPREHENSIVE INCOME Less: Total comprehensive income attributable to noncontrolling interests TOTAL COMPREHENSIVE INCOME ATTRIBUTABLE TO PROCTER & GAMBLE $ S 2018 9,861 $ 15,411 S (6) (299) (148) 334 (119) 9,742 109 2017 9,633 S 239 (306) (59) 1,401 1,275 16,686 85 16,601 $ 2016 10,604 (1,679) 1 28 (1,477) (3,127) 7,477 96 7,381 Consolidated Balance Sheets Amounts in millions: As of June 30 Assets CURRENT ASSETS Cash and cash equivalents Available-for-sale investment securities Accounts receivable INVENTORIES Materials and supplies Work in process Finished goods Total inventories Prepaid expenses and other current assets TOTAL CURRENT ASSETS PROPERTY, PLANT AND EQUIPMENT, NET GOODWILL TRADEMARKS AND OTHER INTANGIBLE ASSETS, NET OTHER NONCURRENT ASSETS TOTAL ASSETS Liabilities and Shareholders' Equity CURRENT LIABILITIES Accounts payable Accrued and other liabilities. Debt due within one year TOTAL CURRENT LIABILITIES LONG-TERM DEBT DEFERRED INCOME TAXES OTHER NONCURRENT LIABILITIES TOTAL LIABILITIES SHAREHOLDERS' EQUITY Convertible Class A preferred stock, stated value $1 per share (600 shares authorized) Non-Voting Class B preferred stock, stated value $1 per share (200 shares authorized) Common stock, stated value $1 per share (10,000 shares authorized; shares issued: 2018 - 4,009.2, 2017 - 4,009.2) Additional paid-in capital Reserve for ESOP debt retirement Accumulated other comprehensive income/(loss) Treasury stock, at cost (shares held: 2018 -1,511.2, 2017 - 1,455.9) Retained earnings Noncontrolling interest TOTAL SHAREHOLDERS' EQUITY TOTAL LIABILITIES AND SHAREHOLDERS' EQUITY The Procter & Gamble Company S S S 2018 2,569 S 9,281 4,686 1,335 588 2,815 4,738 2,046 23.320 20,600 45,175 23,902 5,313 118,310 S 10,344 S 7,470 10,423 28,237 20,863 6,163 10,164 65,427 967 4,009 63,846 (1,204) (14,749) (99,217) 98,641 590 52,883 S 118,310 2017 39 5,569 9,568 4,594 1,308 529 2,787 4,624 2,139 26,494 19,893 44,699 24,187 5,133 120,406 9,632 7,024 13,554 30,210 18,038 8,126 8,254 64,628 1,006 4,009 63,641 (1,249) (14,632) (93,715) 96,124 594 55,778 S 120,406 40 The Procter & Gamble Company Consolidated Statements of Shareholders' Equity Add- itional Common Stock Preferred Paid-In Amount Stock Capital BALANCE JUNE 30, 2015 2,714,571 $4,009 $1,077 $63,852 Shares Dollars in millions; shares in thousands Net earnings Other comprehensive loss Dividends and dividend equivalents: Common Other comprehensive loss Dividends and dividend equivalents: Common Preferred, net of tax benefits Treasury stock purchases (2) Employee stock plans Preferred stock conversions (103,449) 52,089 4,863 Preferred, net of tax benefits Treasury stock purchases () Employee stock plans Preferred stock conversions ESOP debt impacts Noncontrolling interest, net BALANCE JUNE 30, 2016 2,668,074 $4,009 $1,038 $63,714 ($1,290) ($15,907) ($82,176) $87,953 Net earnings 15,326 (164,866) 45,848 4,241 (39) (81,439) 21,655 4,580 (32) (144) 6 (39) (77) 4 Accumu- lated Other Total Share- Non- Equity Comp- Reserve for rehensive ESOP Debt Income Treasury Retained controlling holders' Retirement (Loss) Stock Earnings Interest ($1,320) ($12,780) ($77,226) $84,807 $631 $63.050 96 10,604 10,508 (3,127) 199 6 30 (3,127) 41 45 1,275 ESOP debt impacts Noncontrolling interest, net BALANCE JUNE 30, 2017 2,553,297 $4,009 $1,006 $63,641 ($1,249) ($14,632) ($93,715) $96.124 Net earnings 9,750 Other comprehensive loss. Dividends and dividend equivalents: Common Preferred, net of tax benefits Treasury stock purchases Employee stock plans Preferred stock conversions ESOP debt impacts Noncontrolling interest, net BALANCE JUNE 30, 2018 2,498,093 $4,009 $967 $63,846 ($1,204) ($14,749) ($99,217) S$98,641 (8,217) 3,234 33 (117) (14,625) 3,058 28 (7,181) (255) (7,004) 1,469 33 74 (6,989) (247) 81 (7,057) (265) 89 104 (85) (85) $642 $57,983 85 15,411 1,275 (7,181) (255) (8,217) 3,090 122 (133) (133) $594 $55,778 111 9,861 (2) (1) Includes $4,213 of treasury shares acquired in the divestiture of the Batteries business (see Note 13). (2) Includes $9,421 of treasury shares received as part of the share exchange in the Beauty Brands transaction (see Note 13). (6,989) (247) (14,625) 2,981 (119) (7,057) (265) (7,004) 1,668 134 (113) (113) $590 $52,883 Consolidated Statements of Cash Flows Amounts in millions: Years ended June 30 CASH AND CASH EQUIVALENTS, BEGINNING OF YEAR OPERATING ACTIVITIES Net earnings Depreciation and amortization Loss on early extinguishment of debt Share-based compensation expense Deferred income taxes Gain on sale of assets Goodwill and intangible asset impairment charges Change in accounts receivable Change in inventories Change in accounts payable, accrued and other liabilities Change in other operating assets and liabilities Other TOTAL OPERATING ACTIVITIES INVESTING ACTIVITIES Capital expenditures Proceeds from asset sales Acquisitions, net of cash acquired Purchases of short-term investments. Proceeds from sales and maturities of short-term investments Pre-divestiture addition of restricted cash related to the Beauty Brands divestiture Cash transferred at closing related to the Beauty Brands divestiture Release of restricted cash upon closing of the Beauty Brands divestiture Cash transferred in Batteries divestiture Change in other investments TOTAL INVESTING ACTIVITIES FINANCING ACTIVITIES Dividends to shareholders. Change in short-term debt Additions to long-term debt Reductions of long-term debt (1) (D) (2) Treasury stock purchases Treasury stock from cash infused in Batteries divestiture Impact of stock options and other TOTAL FINANCING ACTIVITIES EFFECT OF EXCHANGE RATE CHANGES ON CASH AND CASH EQUIVALENTS CHANGE IN CASH AND CASH EQUIVALENTS CASH AND CASH EQUIVALENTS, END OF YEAR SUPPLEMENTAL DISCLOSURE Cash payments for interest Cash payment for income taxes Divestiture of Batteries business in exchange for shares of P&G stock (2) Divestiture of Beauty business in exchange for shares of P&G stock and assumption of debt Assets acquired through non-cash capital leases are immaterial for all periods. The Procter & Gamble Company 41 2018 5,569 9,861 2,834 346 395 (1,844) (176) (177) (188) 1,385 2,000 431 14,867 (3,717) 269 (109) (3,909) 3,928 - 27 (3,511) (7,310) (3,437) 5,072 (2,873) (7,004) 1,177 (14,375) 19 (3,000) $ 2,569 529 2,830 Includes early extinguishment of debt costs of $346 and $543 in 2018 and 2017, respectively. Includes $1,730 from cash infused into the Batteries business pursuant to the divestiture agreement (see Note 13). - 2017 S 7,102 $ 15,411 2,820 543 351 (601) (5,490) (322) 71 S (149) (43) 162 12.753 (3,384) 571 (16) (4,843) 1,488 (874) (475) 1,870 (26) (5,689) (7,236) 2,727 3,603 (4,931) (5,204) ** 2,473 (8,568) (29) (1.533) S 5,569 518 3,714 11,360 2016 $ 6,836 10,604 3,078 335 (815) (41) 450 35 116 1,285 204 184 15,435 (3,314) 432 (186) (2,815) 1,354 (996) (143) 93 (5,575) (7,436) (418) 3,916 (2,213) (4,004) (1,730) 2,672 (9,213) (381) 266 $ 7,102 569 3,730 4,213 Calculate the company's current ratio for both the recent year and the prior year. Show your computations. Write the textbook formula here: Recent year: Prior year: Explain what information this ratio provides (define), and what the results mean to this company. Use complete sentences and your own words. Compare the two, has the current ratio improved? Consolidated Statements of Earnings Amounts in millions except per share amounts: Years ended June 30 NET SALES Cost of products sold Selling, general and administrative expense OPERATING INCOME Interest expense Interest income Other non-operating income/(expense), net EARNINGS FROM CONTINUING OPERATIONS BEFORE INCOME TAXES Income taxes on continuing operations NET EARNINGS FROM CONTINUING OPERATIONS NET EARNINGS FROM DISCONTINUED OPERATIONS NET EARNINGS Less: Net earnings attributable to noncontrolling interests NET EARNINGS ATTRIBUTABLE TO PROCTER & GAMBLE BASIC NET EARNINGS PER COMMON SHARE: () Earnings from continuing operations Earnings from discontinued operations BASIC NET EARNINGS PER COMMON SHARE DILUTED NET EARNINGS PER COMMON SHARE: () Earnings from continuing operations Earnings from discontinued operations DILUTED NET EARNINGS PER COMMON SHARE DIVIDENDS PER COMMON SHARE (1) 2018 2017 S 66,832 $ 65,058 34,268 32,535 The Procter & Gamble Company $ 18,568 13,955 465 171 (404) 13,257 3,063 10,194 5,217 9,861 15,411 111 85 S 9,750 $ 15,326 $ 10,508 $ 18,853 13,711 506 247 (126) S 3.75 S S 13,326 3,465 9,861 $ 3.75 $ 3.67 $ 2016 $ 65,299 32,909 18,949 13,441 579 37 3.79 S 2.01 5.80 $ 3.69 $ 1.90 182 325 13,369 3,342 10,027 577 10,604 96 3.59 0.21 3.80 3.49 0.20 3.67 S 5.59 $ 3.69 2.79 $ 2.70 $ 2.66 Basic net earnings per common share and Diluted net earnings per common share are calculated on Net earnings attributable to Procter & Gamble. 38 The Procter & Gamble Company Consolidated Statements of Comprehensive Income Amounts in millions: Years ended June 30 NET EARNINGS OTHER COMPREHENSIVE INCOME/(LOSS), NET OF TAX Financial statement foreign currency translation Unrealized gains/(losses) on hedges (net of $(279), S(186) and $5 tax, respectively) Unrealized gains/(losses) on investment securities (net of $0, $(6) and $7 tax, respectively) Unrealized gains/(losses) on defined benefit retirement plans (net of $68, $551 and $(621) tax, respectively) TOTAL OTHER COMPREHENSIVE INCOME/(LOSS), NET OF TAX TOTAL COMPREHENSIVE INCOME Less: Total comprehensive income attributable to noncontrolling interests TOTAL COMPREHENSIVE INCOME ATTRIBUTABLE TO PROCTER & GAMBLE $ S 2018 9,861 $ 15,411 S (6) (299) (148) 334 (119) 9,742 109 2017 9,633 S 239 (306) (59) 1,401 1,275 16,686 85 16,601 $ 2016 10,604 (1,679) 1 28 (1,477) (3,127) 7,477 96 7,381 Consolidated Balance Sheets Amounts in millions: As of June 30 Assets CURRENT ASSETS Cash and cash equivalents Available-for-sale investment securities Accounts receivable INVENTORIES Materials and supplies Work in process Finished goods Total inventories Prepaid expenses and other current assets TOTAL CURRENT ASSETS PROPERTY, PLANT AND EQUIPMENT, NET GOODWILL TRADEMARKS AND OTHER INTANGIBLE ASSETS, NET OTHER NONCURRENT ASSETS TOTAL ASSETS Liabilities and Shareholders' Equity CURRENT LIABILITIES Accounts payable Accrued and other liabilities. Debt due within one year TOTAL CURRENT LIABILITIES LONG-TERM DEBT DEFERRED INCOME TAXES OTHER NONCURRENT LIABILITIES TOTAL LIABILITIES SHAREHOLDERS' EQUITY Convertible Class A preferred stock, stated value $1 per share (600 shares authorized) Non-Voting Class B preferred stock, stated value $1 per share (200 shares authorized) Common stock, stated value $1 per share (10,000 shares authorized; shares issued: 2018 - 4,009.2, 2017 - 4,009.2) Additional paid-in capital Reserve for ESOP debt retirement Accumulated other comprehensive income/(loss) Treasury stock, at cost (shares held: 2018 -1,511.2, 2017 - 1,455.9) Retained earnings Noncontrolling interest TOTAL SHAREHOLDERS' EQUITY TOTAL LIABILITIES AND SHAREHOLDERS' EQUITY The Procter & Gamble Company S S S 2018 2,569 S 9,281 4,686 1,335 588 2,815 4,738 2,046 23.320 20,600 45,175 23,902 5,313 118,310 S 10,344 S 7,470 10,423 28,237 20,863 6,163 10,164 65,427 967 4,009 63,846 (1,204) (14,749) (99,217) 98,641 590 52,883 S 118,310 2017 39 5,569 9,568 4,594 1,308 529 2,787 4,624 2,139 26,494 19,893 44,699 24,187 5,133 120,406 9,632 7,024 13,554 30,210 18,038 8,126 8,254 64,628 1,006 4,009 63,641 (1,249) (14,632) (93,715) 96,124 594 55,778 S 120,406 40 The Procter & Gamble Company Consolidated Statements of Shareholders' Equity Add- itional Common Stock Preferred Paid-In Amount Stock Capital BALANCE JUNE 30, 2015 2,714,571 $4,009 $1,077 $63,852 Shares Dollars in millions; shares in thousands Net earnings Other comprehensive loss Dividends and dividend equivalents: Common Other comprehensive loss Dividends and dividend equivalents: Common Preferred, net of tax benefits Treasury stock purchases (2) Employee stock plans Preferred stock conversions (103,449) 52,089 4,863 Preferred, net of tax benefits Treasury stock purchases () Employee stock plans Preferred stock conversions ESOP debt impacts Noncontrolling interest, net BALANCE JUNE 30, 2016 2,668,074 $4,009 $1,038 $63,714 ($1,290) ($15,907) ($82,176) $87,953 Net earnings 15,326 (164,866) 45,848 4,241 (39) (81,439) 21,655 4,580 (32) (144) 6 (39) (77) 4 Accumu- lated Other Total Share- Non- Equity Comp- Reserve for rehensive ESOP Debt Income Treasury Retained controlling holders' Retirement (Loss) Stock Earnings Interest ($1,320) ($12,780) ($77,226) $84,807 $631 $63.050 96 10,604 10,508 (3,127) 199 6 30 (3,127) 41 45 1,275 ESOP debt impacts Noncontrolling interest, net BALANCE JUNE 30, 2017 2,553,297 $4,009 $1,006 $63,641 ($1,249) ($14,632) ($93,715) $96.124 Net earnings 9,750 Other comprehensive loss. Dividends and dividend equivalents: Common Preferred, net of tax benefits Treasury stock purchases Employee stock plans Preferred stock conversions ESOP debt impacts Noncontrolling interest, net BALANCE JUNE 30, 2018 2,498,093 $4,009 $967 $63,846 ($1,204) ($14,749) ($99,217) S$98,641 (8,217) 3,234 33 (117) (14,625) 3,058 28 (7,181) (255) (7,004) 1,469 33 74 (6,989) (247) 81 (7,057) (265) 89 104 (85) (85) $642 $57,983 85 15,411 1,275 (7,181) (255) (8,217) 3,090 122 (133) (133) $594 $55,778 111 9,861 (2) (1) Includes $4,213 of treasury shares acquired in the divestiture of the Batteries business (see Note 13). (2) Includes $9,421 of treasury shares received as part of the share exchange in the Beauty Brands transaction (see Note 13). (6,989) (247) (14,625) 2,981 (119) (7,057) (265) (7,004) 1,668 134 (113) (113) $590 $52,883 Consolidated Statements of Cash Flows Amounts in millions: Years ended June 30 CASH AND CASH EQUIVALENTS, BEGINNING OF YEAR OPERATING ACTIVITIES Net earnings Depreciation and amortization Loss on early extinguishment of debt Share-based compensation expense Deferred income taxes Gain on sale of assets Goodwill and intangible asset impairment charges Change in accounts receivable Change in inventories Change in accounts payable, accrued and other liabilities Change in other operating assets and liabilities Other TOTAL OPERATING ACTIVITIES INVESTING ACTIVITIES Capital expenditures Proceeds from asset sales Acquisitions, net of cash acquired Purchases of short-term investments. Proceeds from sales and maturities of short-term investments Pre-divestiture addition of restricted cash related to the Beauty Brands divestiture Cash transferred at closing related to the Beauty Brands divestiture Release of restricted cash upon closing of the Beauty Brands divestiture Cash transferred in Batteries divestiture Change in other investments TOTAL INVESTING ACTIVITIES FINANCING ACTIVITIES Dividends to shareholders. Change in short-term debt Additions to long-term debt Reductions of long-term debt (1) (D) (2) Treasury stock purchases Treasury stock from cash infused in Batteries divestiture Impact of stock options and other TOTAL FINANCING ACTIVITIES EFFECT OF EXCHANGE RATE CHANGES ON CASH AND CASH EQUIVALENTS CHANGE IN CASH AND CASH EQUIVALENTS CASH AND CASH EQUIVALENTS, END OF YEAR SUPPLEMENTAL DISCLOSURE Cash payments for interest Cash payment for income taxes Divestiture of Batteries business in exchange for shares of P&G stock (2) Divestiture of Beauty business in exchange for shares of P&G stock and assumption of debt Assets acquired through non-cash capital leases are immaterial for all periods. The Procter & Gamble Company 41 2018 5,569 9,861 2,834 346 395 (1,844) (176) (177) (188) 1,385 2,000 431 14,867 (3,717) 269 (109) (3,909) 3,928 - 27 (3,511) (7,310) (3,437) 5,072 (2,873) (7,004) 1,177 (14,375) 19 (3,000) $ 2,569 529 2,830 Includes early extinguishment of debt costs of $346 and $543 in 2018 and 2017, respectively. Includes $1,730 from cash infused into the Batteries business pursuant to the divestiture agreement (see Note 13). - 2017 S 7,102 $ 15,411 2,820 543 351 (601) (5,490) (322) 71 S (149) (43) 162 12.753 (3,384) 571 (16) (4,843) 1,488 (874) (475) 1,870 (26) (5,689) (7,236) 2,727 3,603 (4,931) (5,204) ** 2,473 (8,568) (29) (1.533) S 5,569 518 3,714 11,360 2016 $ 6,836 10,604 3,078 335 (815) (41) 450 35 116 1,285 204 184 15,435 (3,314) 432 (186) (2,815) 1,354 (996) (143) 93 (5,575) (7,436) (418) 3,916 (2,213) (4,004) (1,730) 2,672 (9,213) (381) 266 $ 7,102 569 3,730 4,213
Expert Answer:

Related Book For 

Financial Accounting
ISBN: 978-1259222139
9th edition
Authors: Robert Libby, Patricia Libby, Frank Hodge
Posted Date:
Students also viewed these finance questions
-
Q1. You have identified a market opportunity for home media players that would cater for older members of the population. Many older people have difficulty in understanding the operating principles...
-
(i) Write down the linear program relaxation for the vertex cover problem and solve the linear program. [6 marks] (ii) Based on the solution of the linear program in (b)(i), derive an integer...
-
A national fast food restaurant chain has recently made the decision that their breakfast menu will now be available all day long. The product management team overseeing the breakfast lines including...
-
Match each term in Column A with its related definition in Column B. Column A 1. __________ Spot rate 2. __________ Currency appreciation 3. __________ Translation risk 4. __________ Transaction risk...
-
Lowering per capita healthcare costs is the most important. Imagine you are a healthcare manager. Understanding that each point is critical to success, which particular tenet of the triple aim...
-
Describe the measurements that must be taken and the equations that must be used to determine the shear creep compliance, \(S_{66}(t)\), of a unidirectional viscoelastic lamina by using a rail shear...
-
Derby, Inc. manufactures golf clubs in three models. For the year, the Eagle line has a net loss of $20,000 from sales $200,000, variable expenses $180,000, and fixed expenses $40,000. If the Eagle...
-
Discuss the advancements in photovoltaic (PV) technology, focusing on the development of high-efficiency solar cells, such as perovskite and tandem cells, and their implications for the evolution of...
-
Hank has a 30% interest in KKC LLC, a calendar year entity. At the beginning of the year, Hank had an outside basis in KKC of $60,000 which included his $10,000 share of KKC liabilities. On July 1st,...
-
Segment reporting is meant to provide deeper transparency on a companys financial situation. It provides more information about the companys specific sources of revenue and net income and discloses...
-
Currency derivatives are used by Rolls-Royce to hedge against exchange rate movements that may affect its proceeds in non-sterling currencies. Suppose Rolls-Royce signed a contract to supply engines...
-
Yin has been following market movements of her portfolio. In October 2020, she decided to sell a losing position in Volkswagen (VW) that she held on the Frankfurt Stock Exchange (Brse Frankfurt). She...
-
Links of London is an iconic jewelry brand with an international presence that captures the wit, spirit, and heart of London. The design team strives to create exquisite jewelry and statement watches...
-
In response to a falling Turkish lira the President of Turkey Recep Tayyip Erdoan on May 11, 2018 called for lower interest rates and described interest rates as the mother and father of all evil. a....
-
With instant coffee, baby food, and bottled water in the mix, Nestl crunches more than just chocolate. The worlds number-one food and drinks company in terms of sales, Nestl is also the world leader...
-
IT Express produces a range of notebooks and diaries that are sold exclusively online via the company's website. Customers have the opportunity to personalise their purchase by selecting designs for...
-
A test car is driven a fixed distance of n miles along a straight highway. (Here n Z+.) The car travels at one mile per hour for the first mile, two miles per hour for the second mile, four miles...
-
Using the financial information presented in Exhibit 13.1, calculate the following ratios for The Home Depot: Net profit margin Earnings quality Receivable turnover Cash ratio Times interest...
-
Wood Company had the following inventory items on hand at the end of the year: Computing the lower of cost or market on an item - by - item basis, determine what amount would be reported on the...
-
North Face is one of the world's most popular outdoor apparel companies. Assume that North Face borrows $2 million from U.S. Bank and signs a note promising to pay the $2 million back in nine months,...
-
What ideas do you have for a new business? How can you multiply the stimuli around these ideas to enhance them and identify attractive opportunities?
-
What do you really enjoy doing? What is your passion? Can your passion be a platform for a viable opportunity?
-
What do your friends and family envision you doing? What strengths and weaknesses do they observe? How do their insights help lead you to an opportunity that is right for you?

Study smarter with the SolutionInn App