

Question: Calculate the companys stock average return, standard deviation, and coefficient of variation for the period 2006-2016. Describe the distribution of your stock returns using the
Calculate the companys stock average return, standard deviation, and coefficient of variation for the period 2006-2016.
Describe the distribution of your stock returns using the statistics above. Compare your stock distribution with that of the S&P 500. Did your company have a higher return than the S&P 500 index? Is your companys stock riskier than the S&P 500 index?
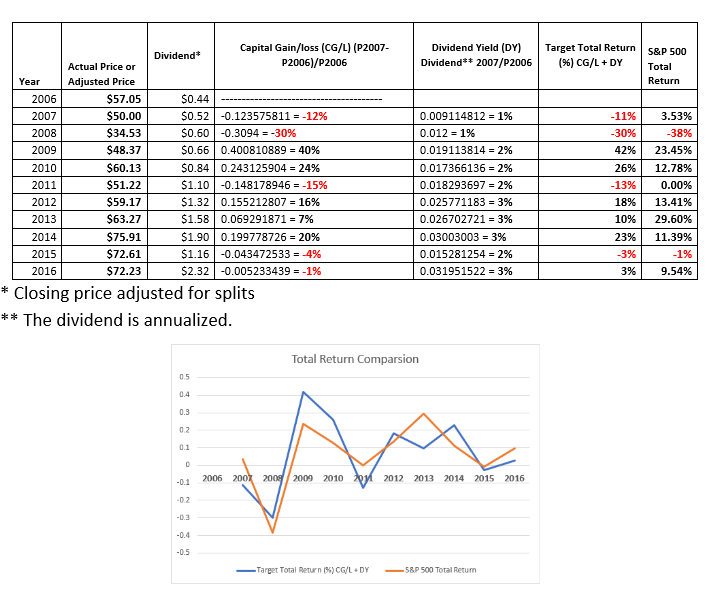
Dividend Yield (DY) Dividend** 2007/P2006 Target Total Return (%) CG/L + DY S&P 500 Total Return Capital Gain/loss (CG/L) (P2007- Dividend* Actual Price or P2006)/P2006 Year Adjusted Price 2006 $57.05 $0.44 --------- 2007 $50.00 $0.52 -0.123575811 = -12% 2008 $34.53 $0.50 -0.3094 = -30% 2009 $48.37 $0.66 0.400810889 = 40% 2010 | $60.13 $0.84 0.243125904 = 24% 2011 $51.22 $1.10 -0.148178946 = -15% 2012 $59.17 $1.32 0.155212807 = 16% 2013 $63.27 $1.58 0.069291871 = 7% 2014 $75.91 $1.90 0.199778726 = 20% 2015 $72.61 $1.16 -0.043472533 = -4% 2016 $72.23 $2.32 -0.005233439 = -1% * Closing price adjusted for splits ** The dividend is annualized. 0.009114812 = 1% 0.012 = 1% 0.019113814 = 2% 0.017366136 = 2% 0.018293697 = 2% 0.025771183 = 3% 0.026702721 = 3% 0.03003003 = 3% 0.015281254 = 2% 0.031951522 = 3% -11% -30% 42% 26% -13% 18% 10% 23% 3% 3% 3.53% -38% 23.45% 12.78% 0.00% 13.41% 29.60% 11.39% 19% 9.54% Total Return Comparsion -0.1 2006 2007 2008/2009 2010 ori 2012 2013 2014 2015 2016 - Target Total Return (%) CG/LDY 5&P 500 Total Retum Dividend Yield (DY) Dividend** 2007/P2006 Target Total Return (%) CG/L + DY S&P 500 Total Return Capital Gain/loss (CG/L) (P2007- Dividend* Actual Price or P2006)/P2006 Year Adjusted Price 2006 $57.05 $0.44 --------- 2007 $50.00 $0.52 -0.123575811 = -12% 2008 $34.53 $0.50 -0.3094 = -30% 2009 $48.37 $0.66 0.400810889 = 40% 2010 | $60.13 $0.84 0.243125904 = 24% 2011 $51.22 $1.10 -0.148178946 = -15% 2012 $59.17 $1.32 0.155212807 = 16% 2013 $63.27 $1.58 0.069291871 = 7% 2014 $75.91 $1.90 0.199778726 = 20% 2015 $72.61 $1.16 -0.043472533 = -4% 2016 $72.23 $2.32 -0.005233439 = -1% * Closing price adjusted for splits ** The dividend is annualized. 0.009114812 = 1% 0.012 = 1% 0.019113814 = 2% 0.017366136 = 2% 0.018293697 = 2% 0.025771183 = 3% 0.026702721 = 3% 0.03003003 = 3% 0.015281254 = 2% 0.031951522 = 3% -11% -30% 42% 26% -13% 18% 10% 23% 3% 3% 3.53% -38% 23.45% 12.78% 0.00% 13.41% 29.60% 11.39% 19% 9.54% Total Return Comparsion -0.1 2006 2007 2008/2009 2010 ori 2012 2013 2014 2015 2016 - Target Total Return (%) CG/LDY 5&P 500 Total Retum
Step by Step Solution
There are 3 Steps involved in it

Get step-by-step solutions from verified subject matter experts