Question: Calculate the control limits, plot the data, and state the conclusion. 0 0 0 6 Table S3.1 Factors for Computing control Chart Limits (Heizer &

Calculate the control limits, plot the data, and state the conclusion. Calculate the control limits, plot the data, and
0 0 0 6 Table S3.1 Factors for Computing control Chart Limits (Heizer & Render, p. 118) Size of individual sample Mean Factor, A Upper Range. De Lower Range, D 2 1.880 3.268 3 1.023 2.574 4 0.729 2.282 5 0.577 2.11 0.483 2.00 CL. = * = 3 Xin UCL = X + A, R LCL = X - AR CLE=R=R, IN UCLX = D.R LCLX =D,R The data for each sample is arranged vertically below the sample number. Calculate the control limits, plot the data and state your conclusion. Please attach any support Excel file printouts or calculations. UCE - 1 - - - - 1 CLX 1 - 1 - 1 1 - - - - LCLX 3 6 UCLA - - - 1 1 1 - CLR - - - 1 - - - - - - 1 - - - - - - LCLR 2 3 4 5 6 8 9 Samples 1 to 6 3 4 5 1 2 6 6 7 8 9 Data Point 1 2 3 16.2 16,1 16.1 16,1 16.2 16.1 16 16 16.2 16 16.2 16.3 16.3 16.1 16.2 16.15 16 16

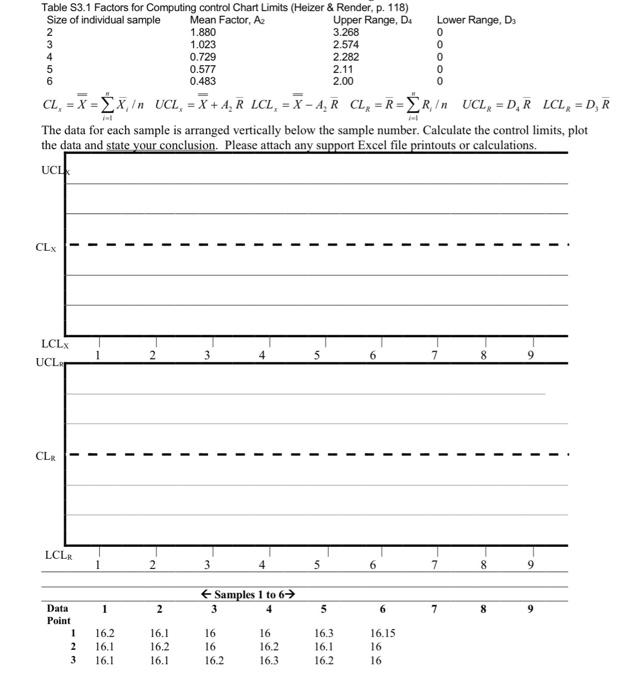
Step by Step Solution

There are 3 Steps involved in it

1 Expert Approved Answer
Step: 1 Unlock blur-text-image
Question Has Been Solved by an Expert!

Get step-by-step solutions from verified subject matter experts

Step: 2 Unlock
Step: 3 Unlock

Students Have Also Explored These Related General Management Questions!