

Question: Calculate the correlation coefficient and interpret the value. 0 A) 0.7; There is a strong positive linear relationship between weight and cortisol levels. 0 B)
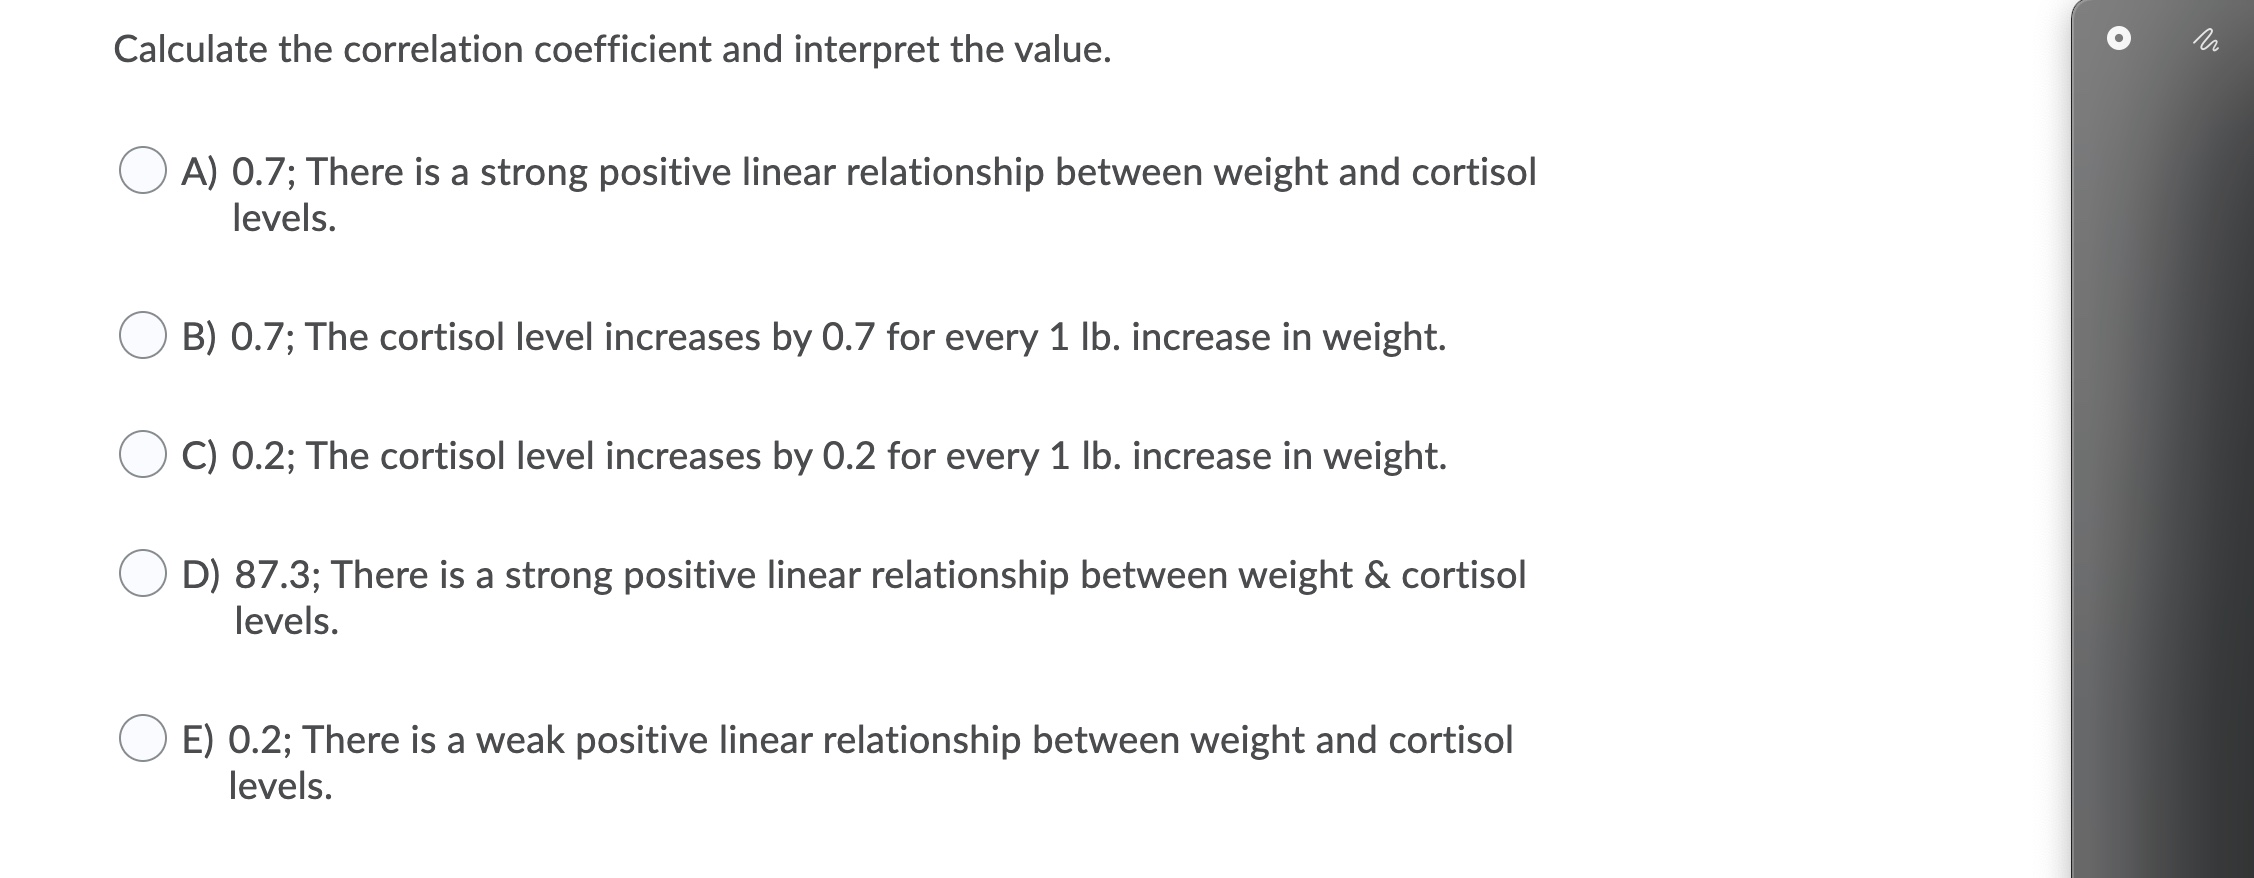
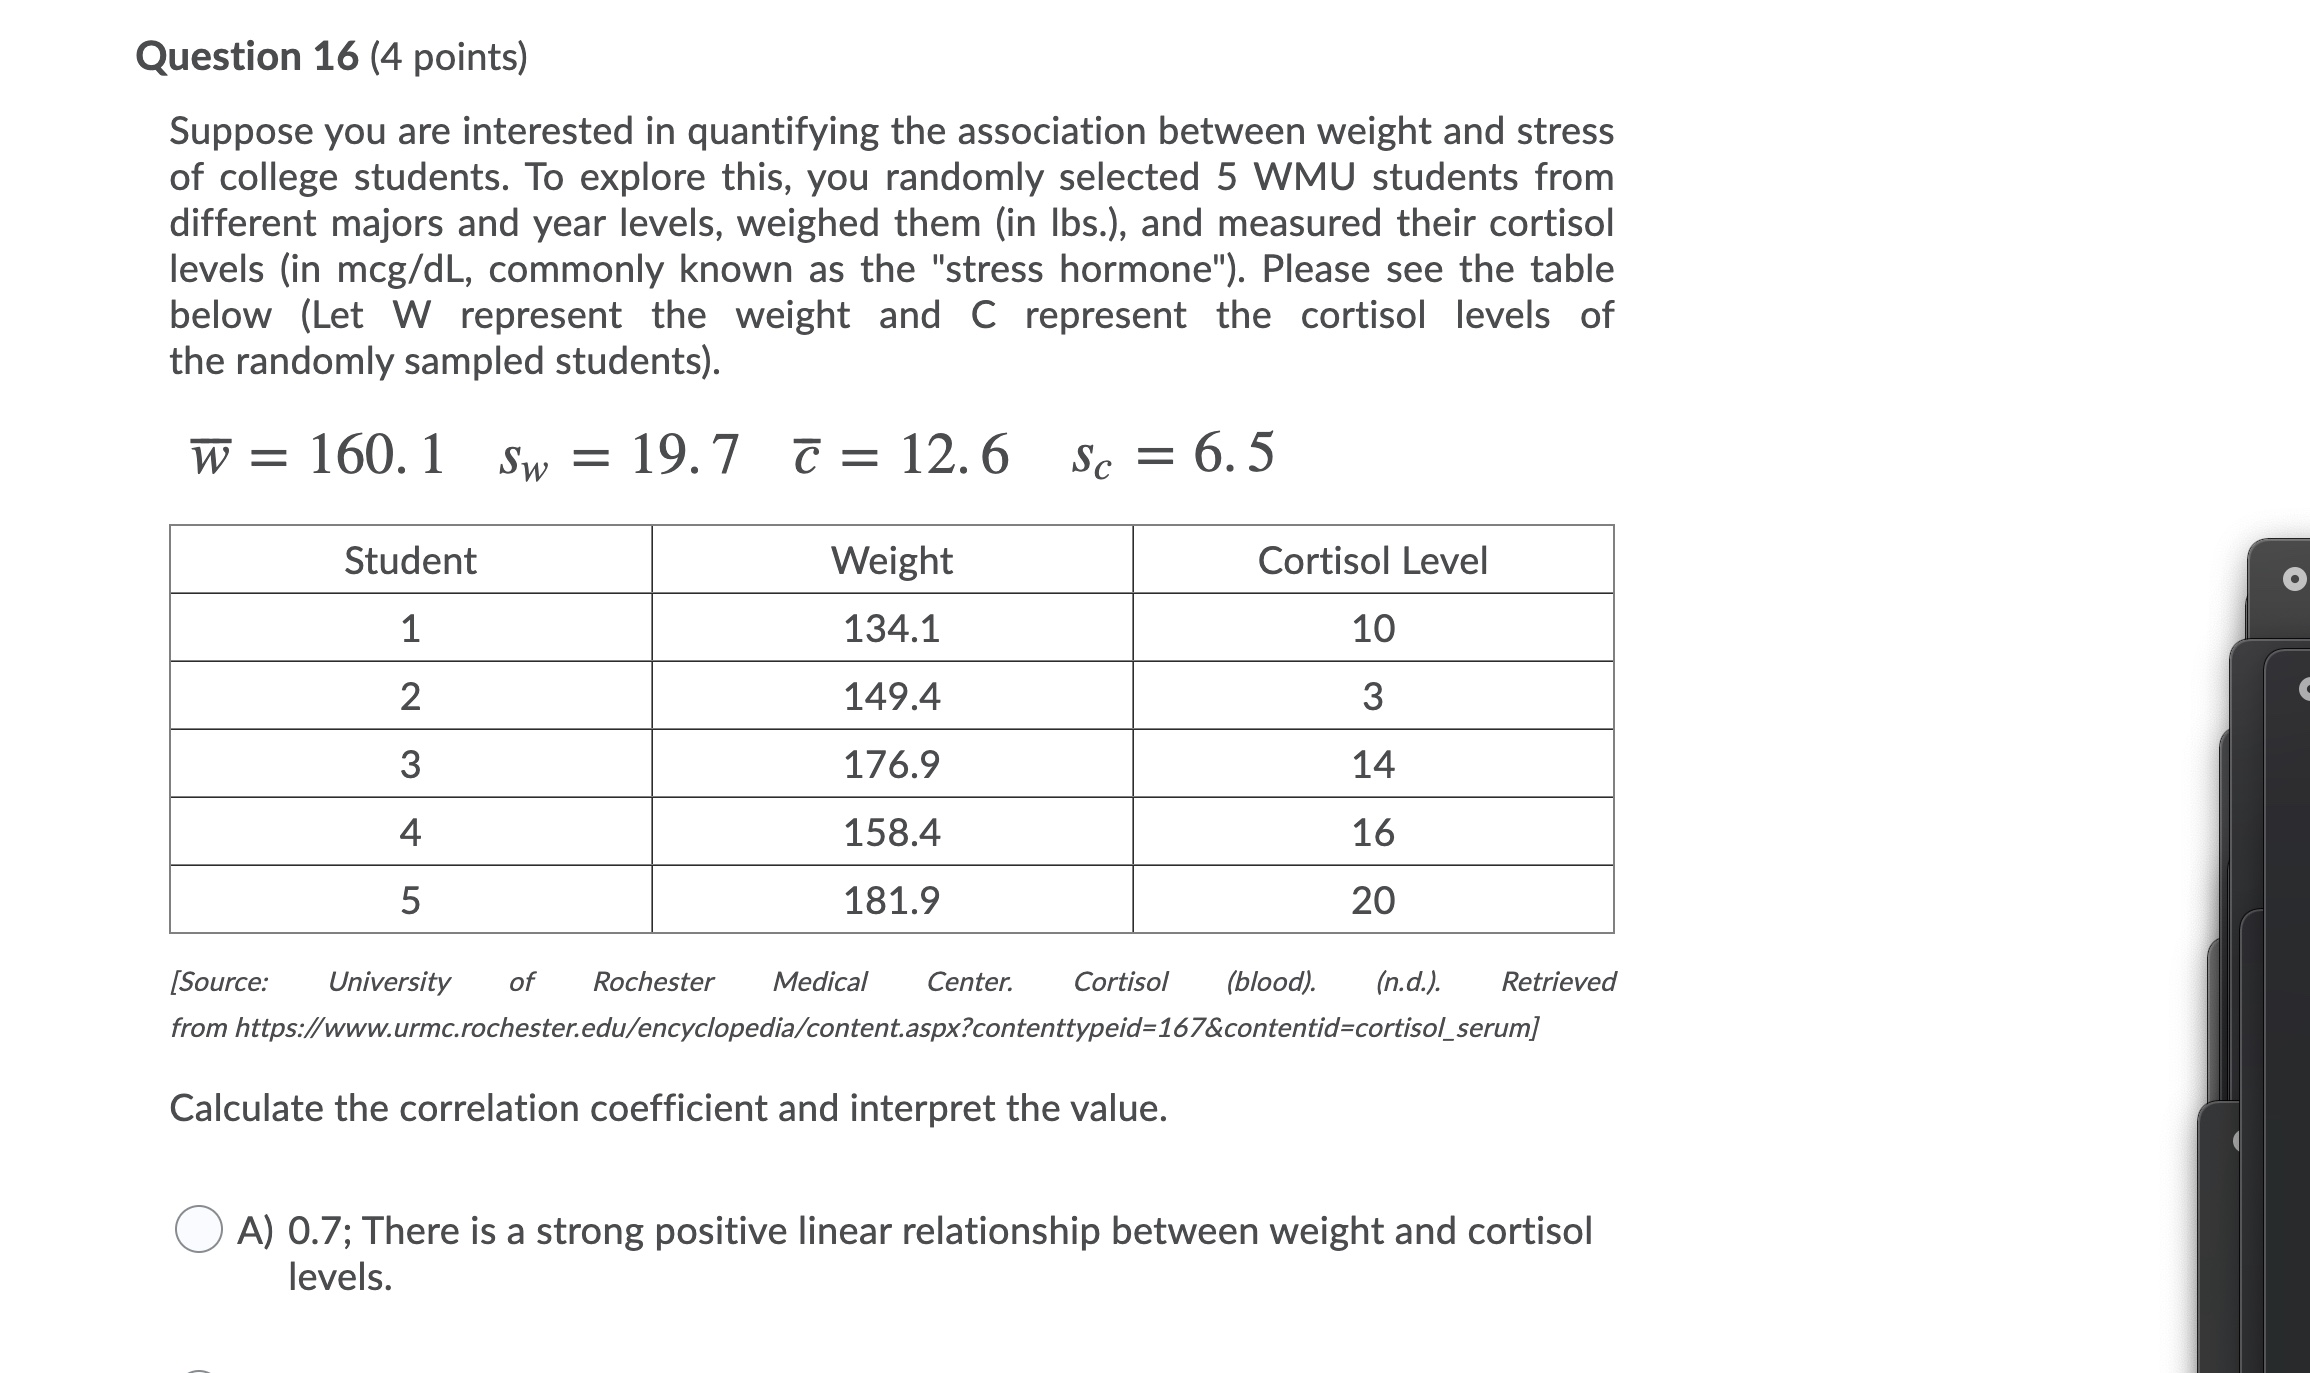
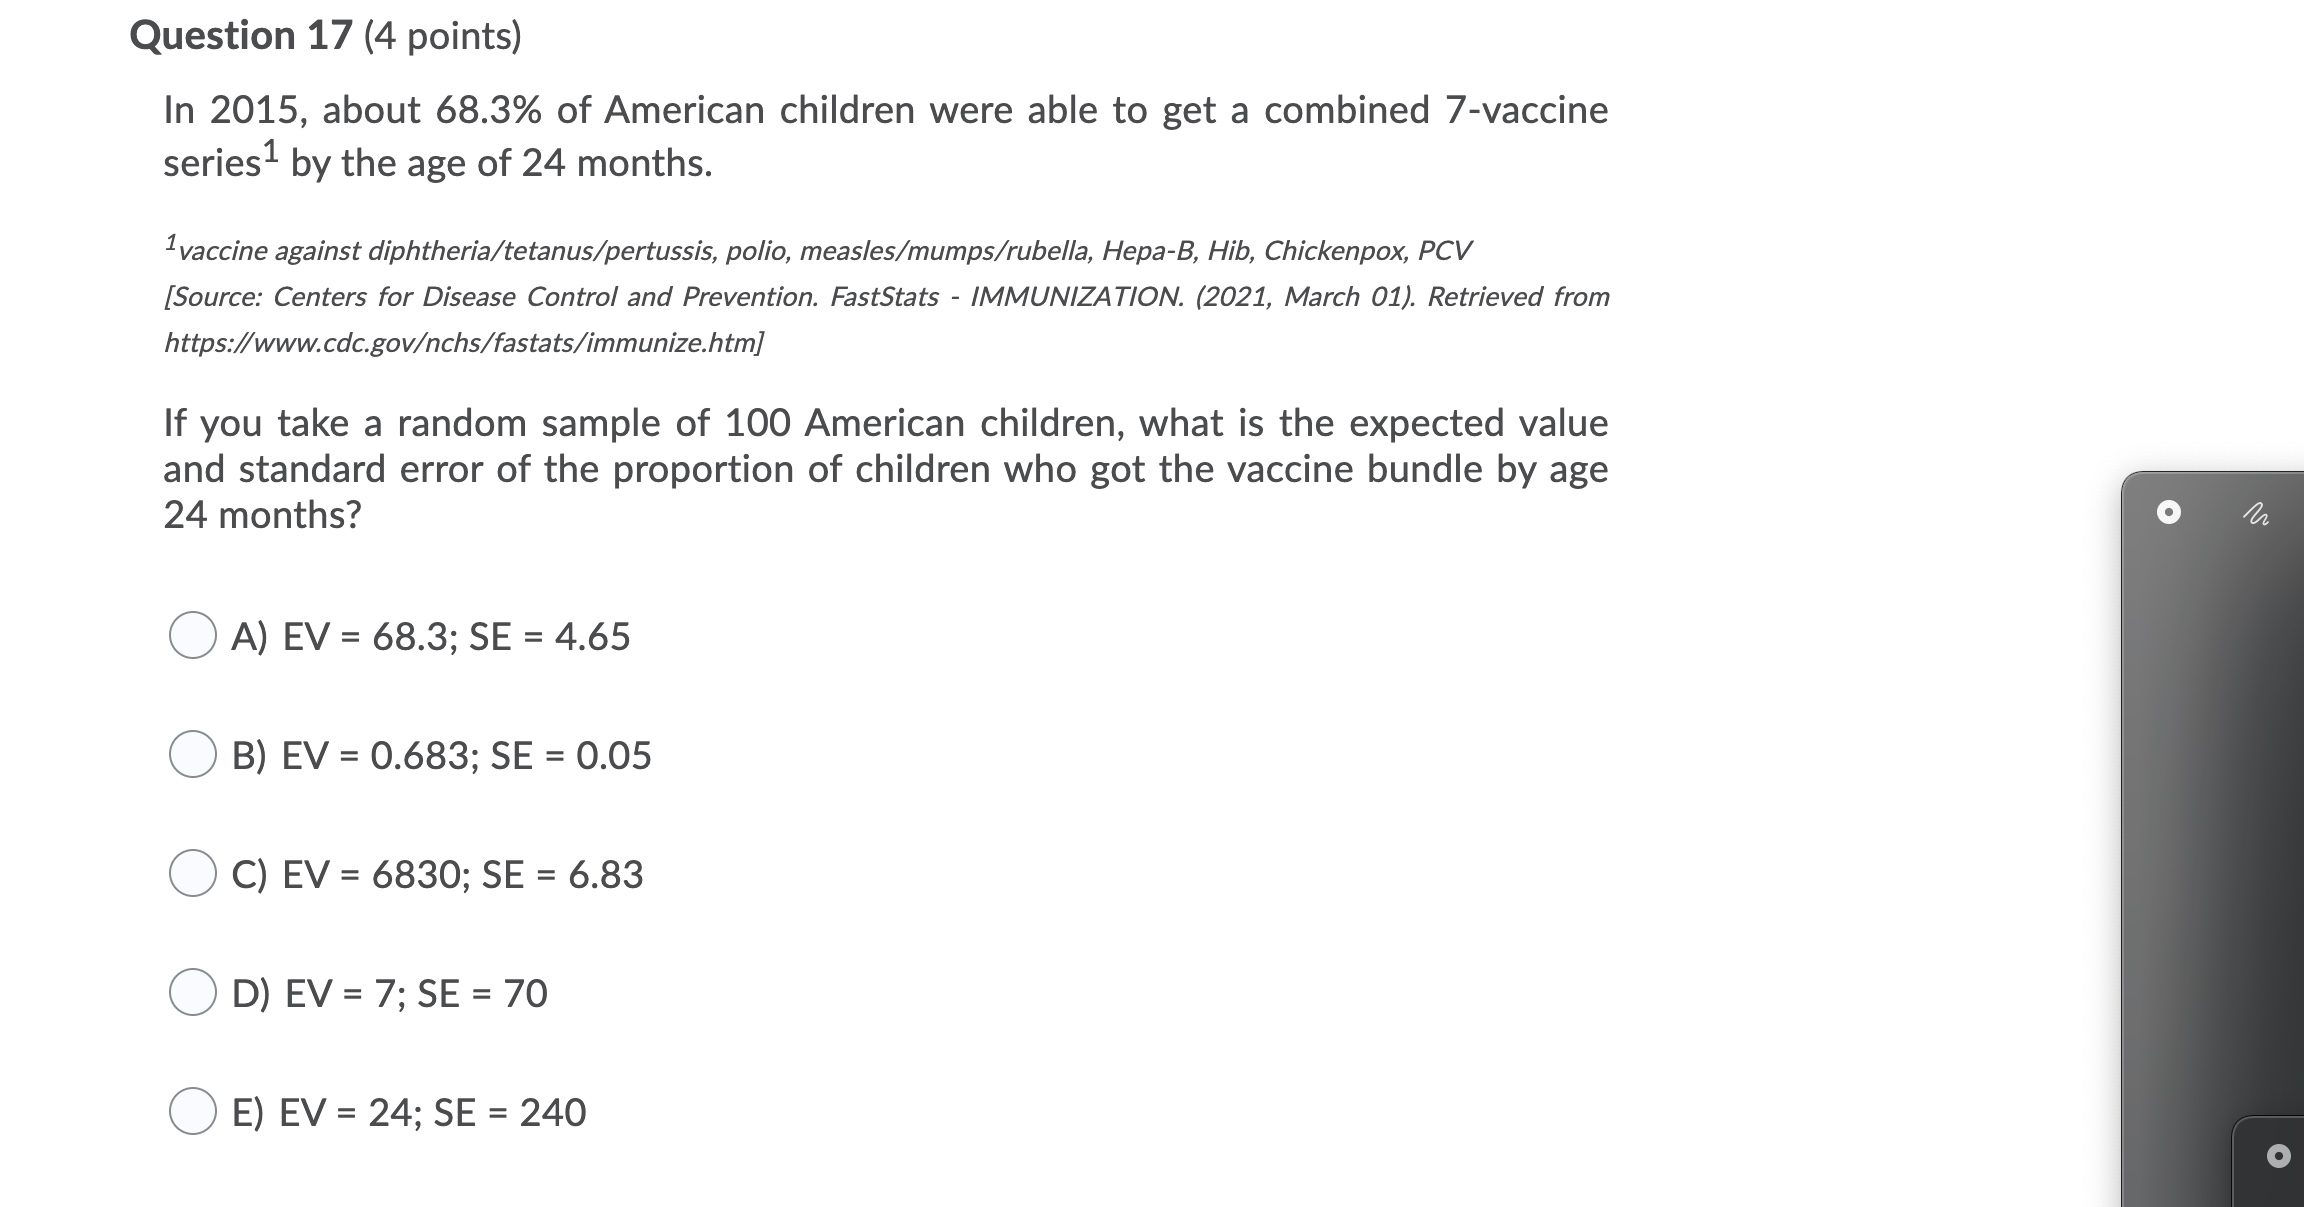
Calculate the correlation coefficient and interpret the value. 0 A) 0.7; There is a strong positive linear relationship between weight and cortisol levels. 0 B) 0.7; The cortisol level increases by 0.7 for every 1 lb. increase in weight. 0 C) 0.2; The cortisol level increases by 0.2 for every 1 lb. increase in weight. 0 D) 87.3; There is a strong positive linear relationship between weight & cortisol levels. 0 E) 0.2; There is a weak positive linear relationship between weight and cortisol levels. Question 16 (4 points) Suppose you are interested in quantifying the association between weight and stress of college students. To explore this, you randomly selected 5 WMU students from different majors and year levels, weighed them (in lbs.), and measured their cortisol levels (in mcg/dL, commonly known as the "stress hormone"). Please see the table below (Let W represent the weight and C represent the cortisol levels of the randomly sampled students). w = 160.1 Sw = 19.7 c = 12.6 Sc = 6.5 Student Weight Cortisol Level O 1 134.1 10 2 149.4 3 3 176.9 14 4 158.4 16 5 181.9 20 [Source: University of Rochester Medical Center. Cortisol (blood). (n.d.). Retrieved from https://www.urmc.rochester.edu/encyclopedia/content.aspx?contenttypeid=167&contentid=cortisol_serum] Calculate the correlation coefficient and interpret the value. ( A) 0.7; There is a strong positive linear relationship between weight and cortisol levels.Question 17 (4 points) In 2015, about 68.3% of American children were able to get a combined 7-vaccine series by the age of 24 months. vaccine against diphtheria/tetanus/pertussis, polio, measles/mumps/rubella, Hepa-B, Hib, Chickenpox, PCV [Source: Centers for Disease Control and Prevention. FastStats - IMMUNIZATION. (2021, March 01). Retrieved from https://www.cdc.govchs/fastats/immunize.htm] If you take a random sample of 100 American children, what is the expected value and standard error of the proportion of children who got the vaccine bundle by age 24 months? O A) EV = 68.3; SE = 4.65 O B) EV = 0.683; SE = 0.05 O C) EV = 6830; SE = 6.83 D) EV = 7; SE = 70 O E) EV = 24; SE = 240 O
Step by Step Solution
There are 3 Steps involved in it

Get step-by-step solutions from verified subject matter experts