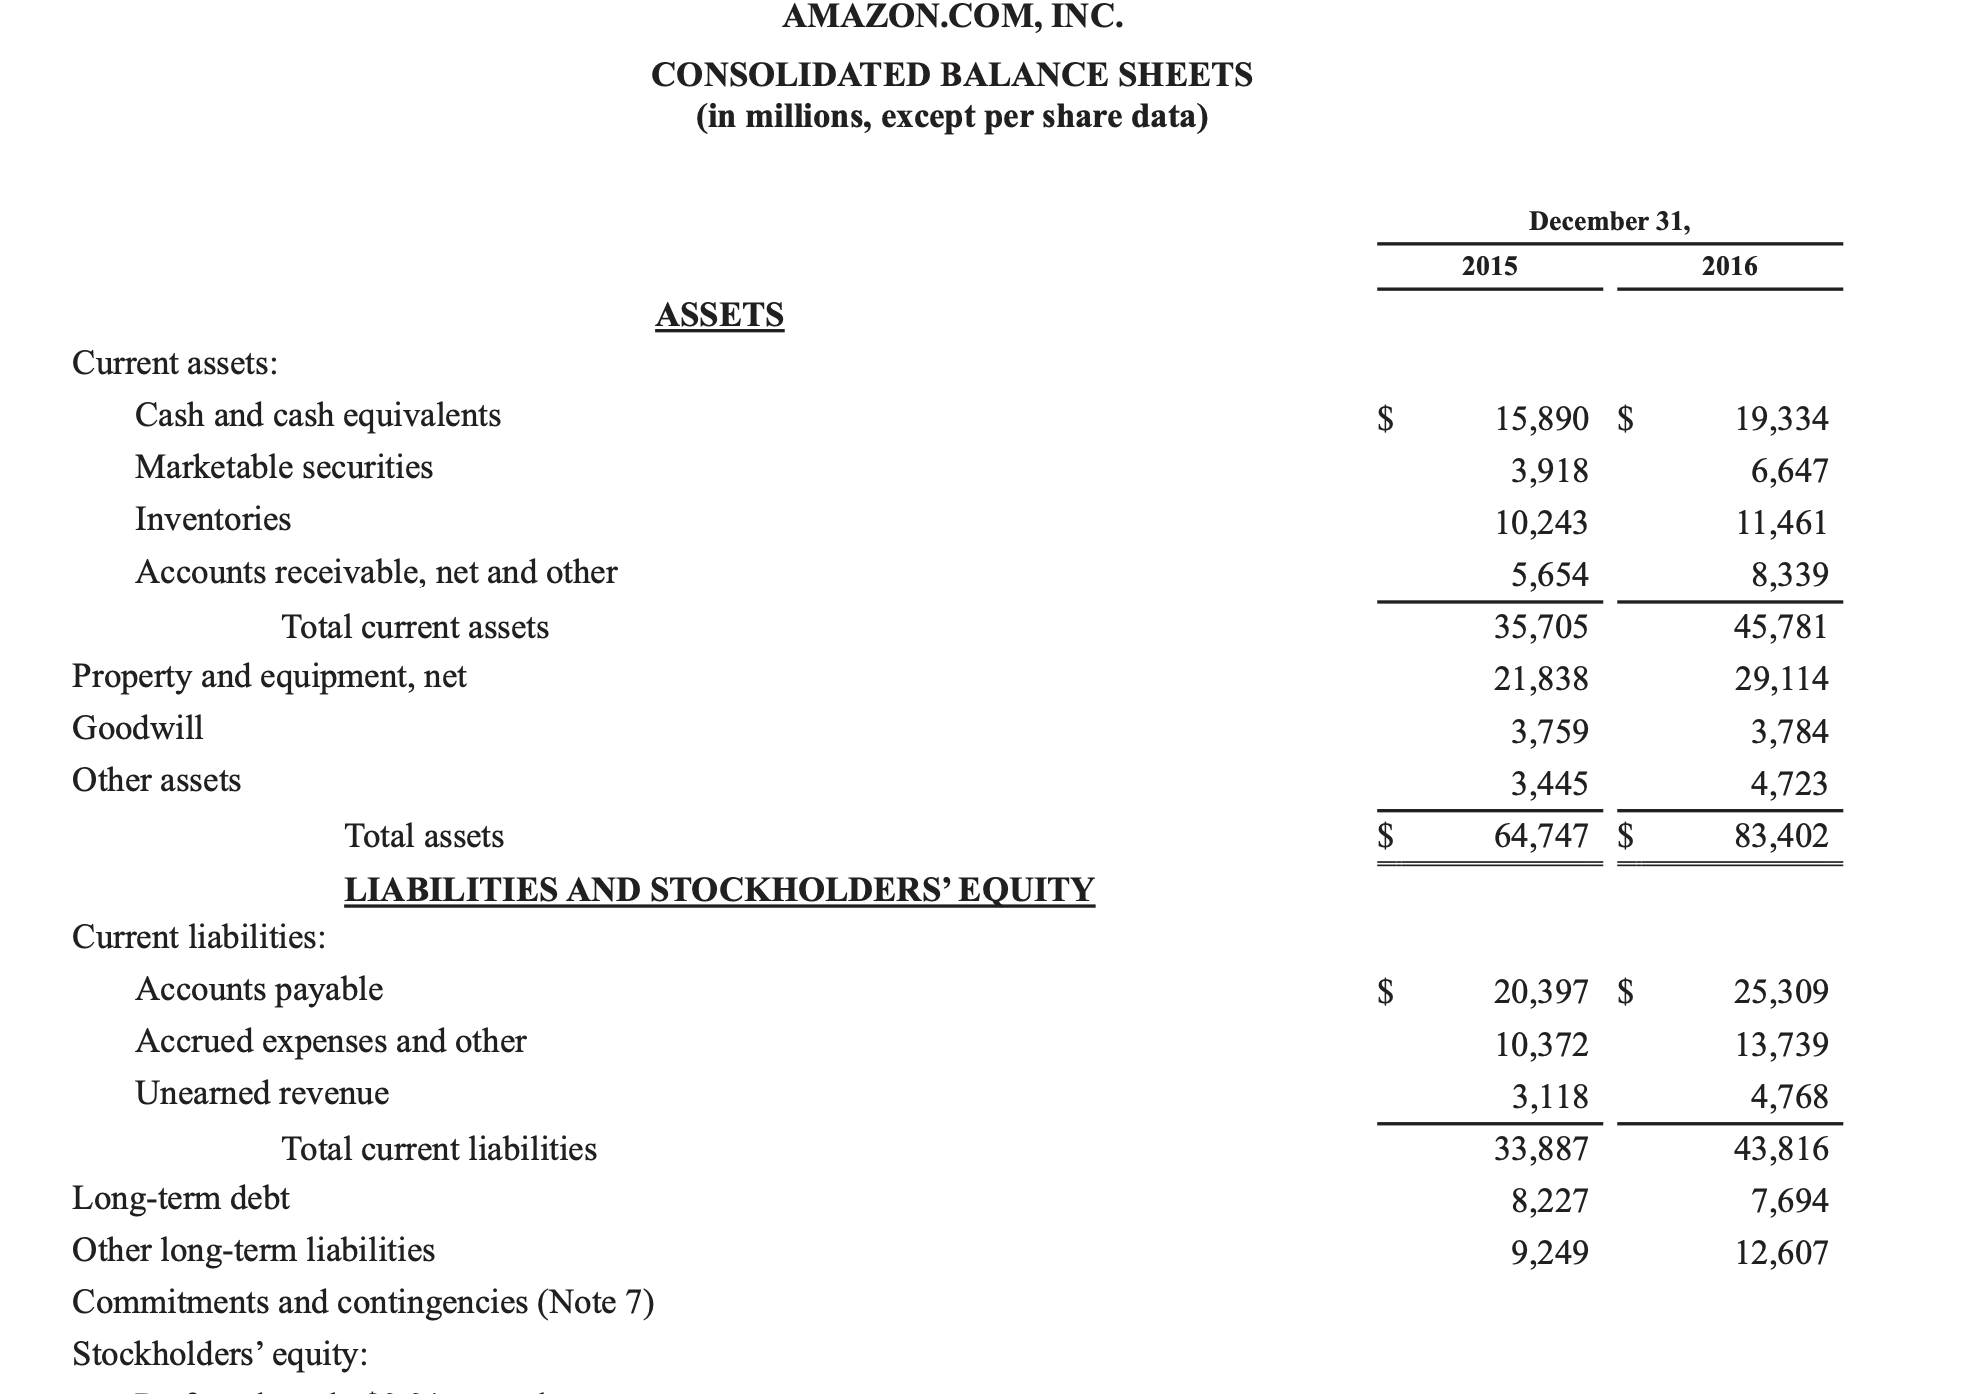
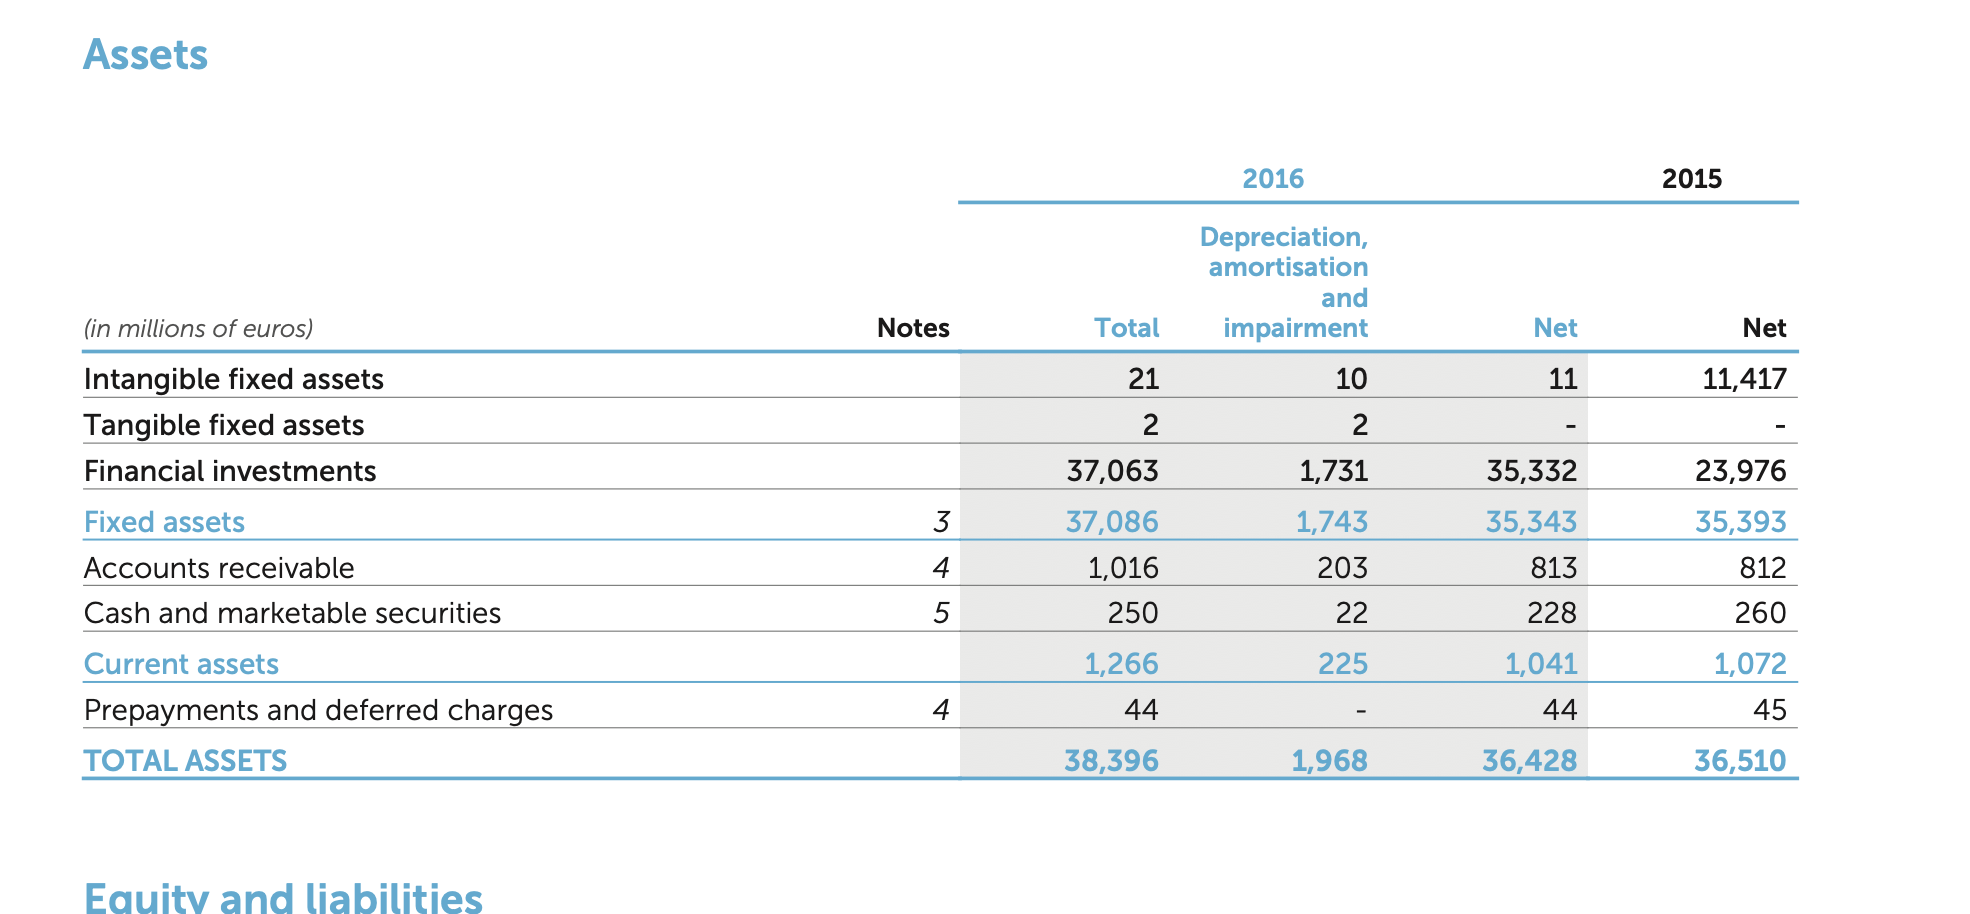
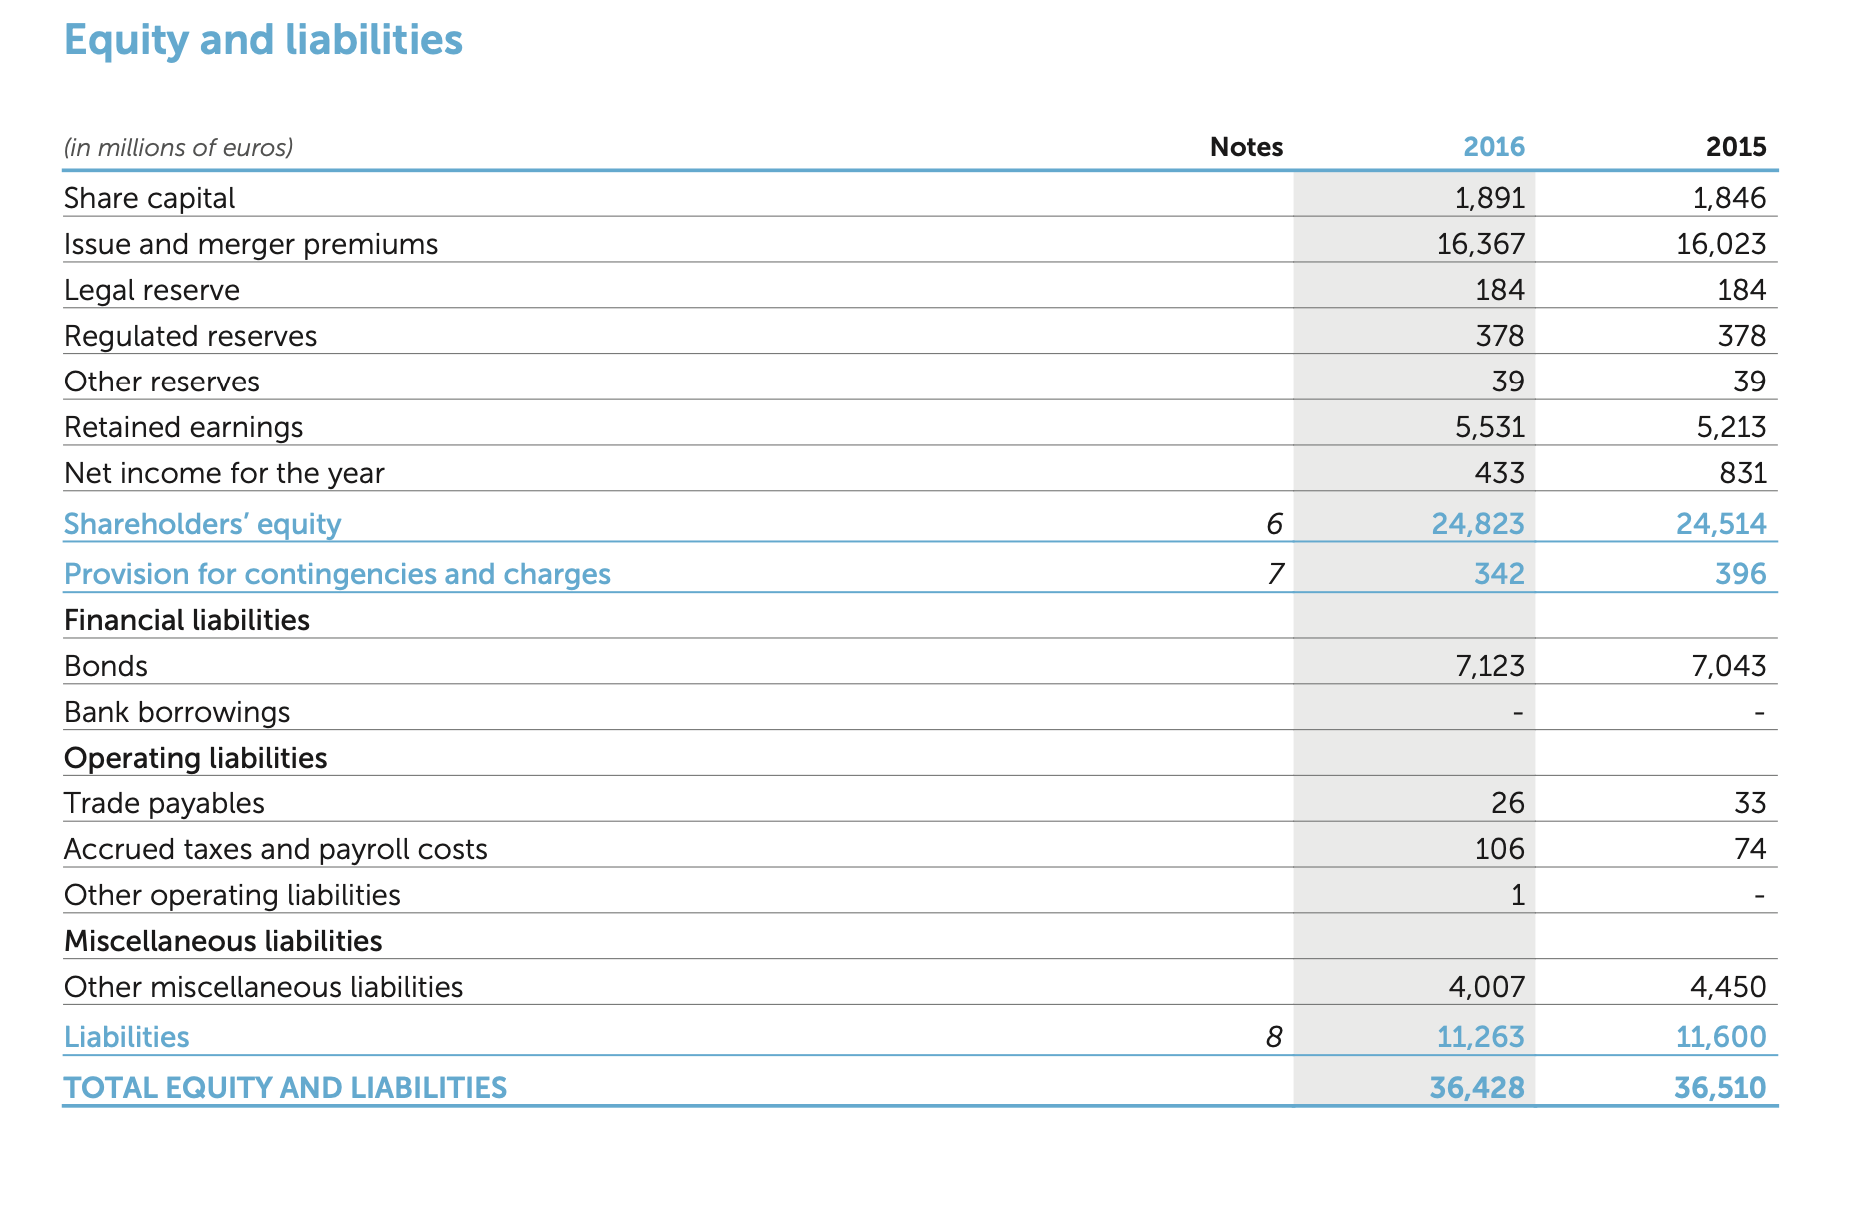
Question: Calculate the current ratio (=current asset-current liabilities) for both CARREFOUR & AMAZON >> Compare these 2 ratios and explain differences by proposing business justifications Year
- Calculate the current ratio (=current asset-current liabilities) for both CARREFOUR &
- AMAZON >> Compare these 2 ratios and explain differences by proposing business
- justifications
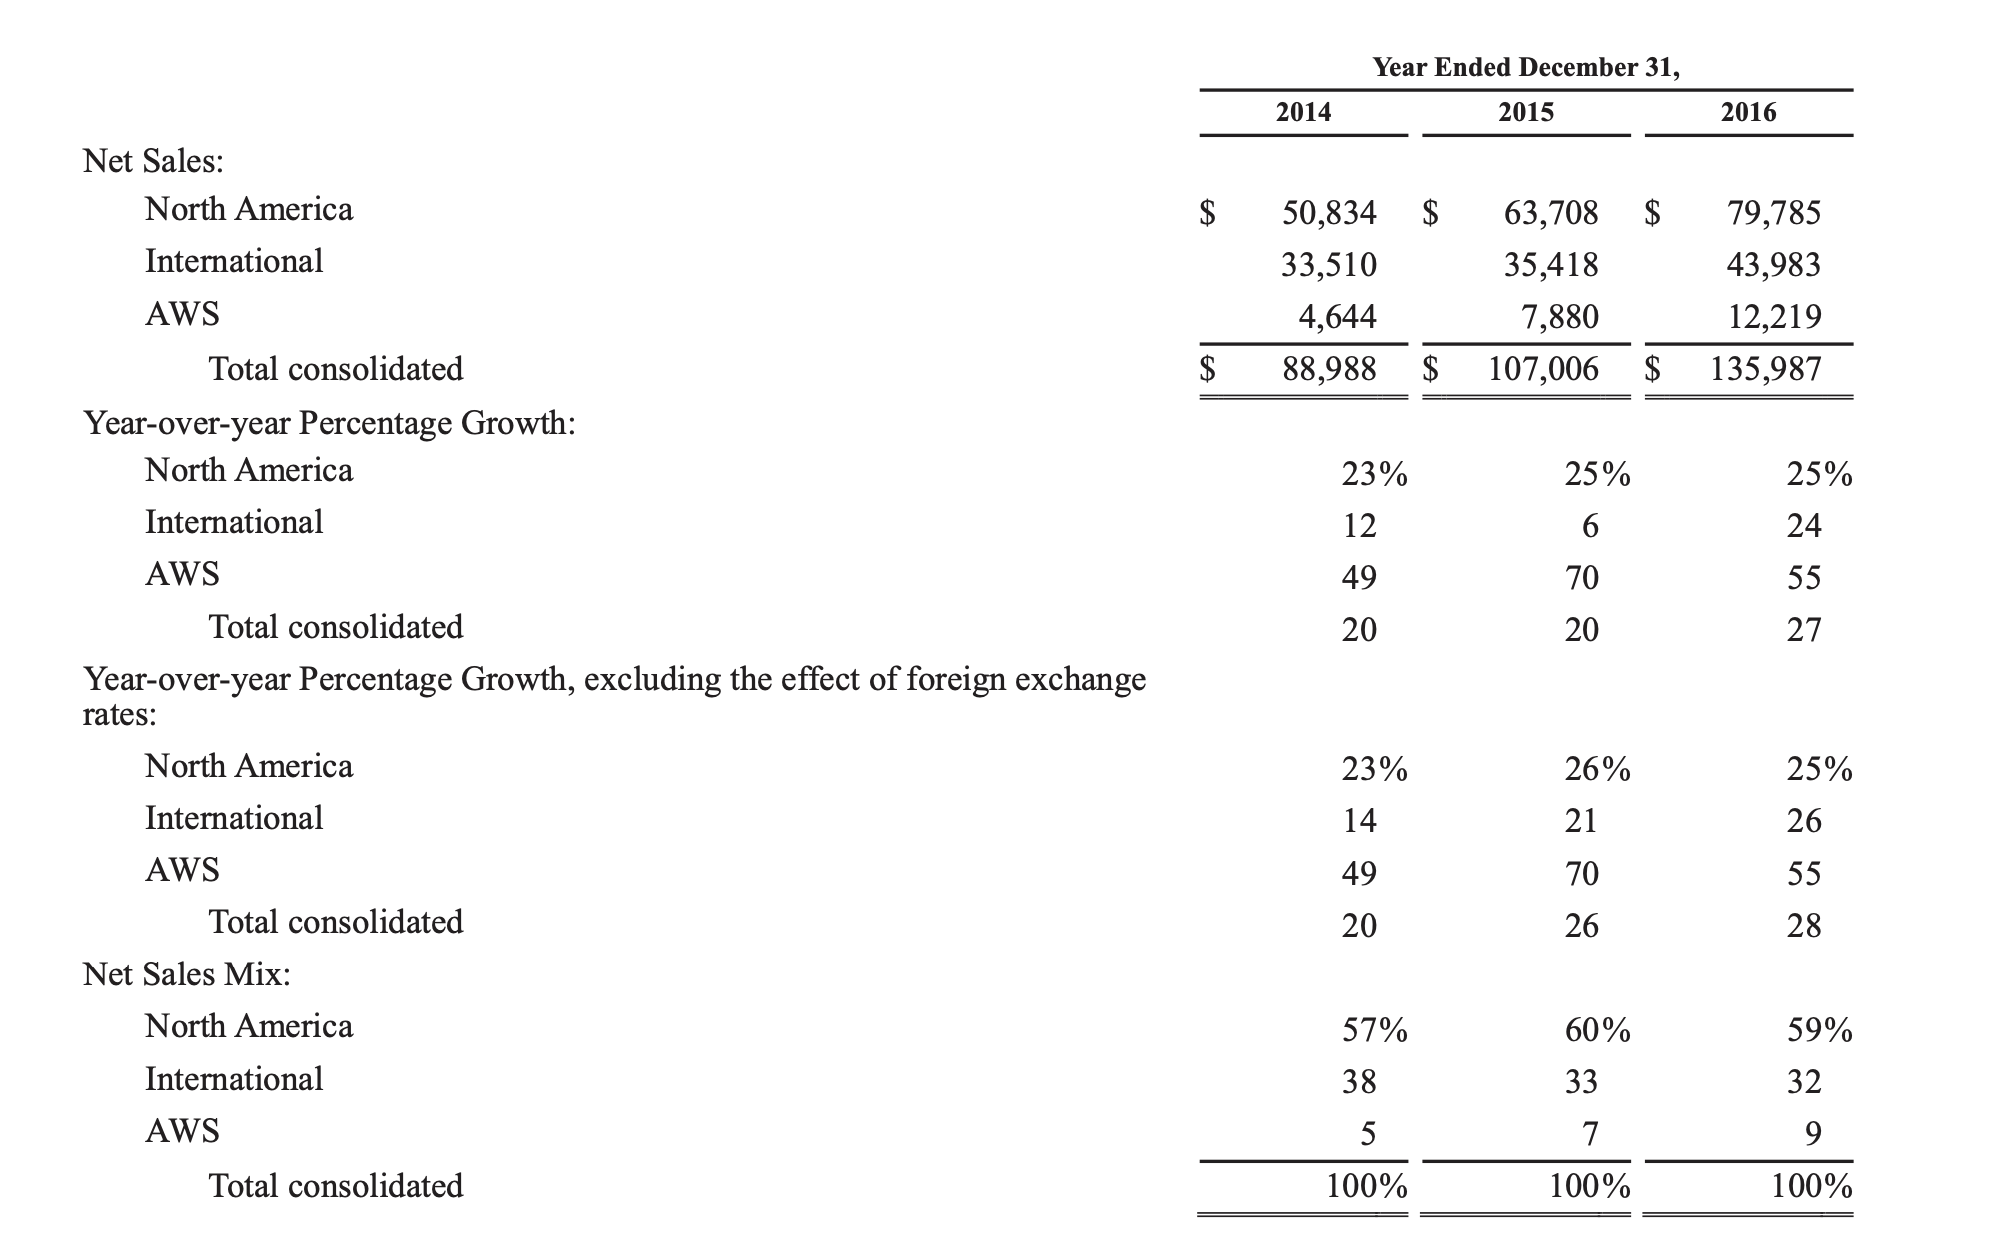
Year Ended December 31, 2014 2015 2016 Net Sales: North America $ 50,834 $ 63,708 $ 79,785 International 33,510 35,418 43,983 AWS 4,644 7,880 12,219 Total consolidated $ 88,988 $ 107,006 $ 135,987 Year-over-year Percentage Growth: North America 23% 25% 25% International 12 6 24 AWS 49 70 55 Total consolidated 20 20 27 Year-over-year Percentage Growth, excluding the effect of foreign exchange rates: North America 23% 26% 25% International 14 21 26 AWS 49 70 55 Total consolidated 20 26 28 Net Sales Mix: North America 57% 60% 59% International 38 33 32 AWS 5 7 9 Total consolidated 100% 100% 100%AMAZON.COM, [N C. CONSOLIDATED BALANCE SHEETS (in millions, except per share data) ASSETS Current assets: Cash and cash equivalents Marketable securities Inventories Accounts receivable, net and other Total current assets Property and equipment, net Goodwill Other assets Total assets LIABILITIES AND STOCKHOLDERS' E Current liabilities: Accounts payable Accrued expenses and other Unearned revenue Total current liabilities Long-term debt Other long-term liabilities Commitments and contingencies (Note 7) Stockholders' equity: UITY December 31, 2015 2016 15,890 $ 19,334 3,918 6,647 10,243 11,461 5,654 8,339 35,705 45,781 21,838 29,114 3,759 3,784 3,445 4,723 64,747 $ 83,402 20,397 $ 25,309 10,372 13,739 3,118 4,768 33,887 43,816 8,227 7,694 9,249 12,607 Assets 2016 2015 Depreciation, amortisation and (in millions of euros) Notes Total impairment Net Net Intangible fixed assets 21 10 11 11,417 Tangible fixed assets 2 2 - - Financial investments 37,063 1,731 35,332 23,976 Fixed assets 3 37,086 1,743 35,343 35,393 Accounts receivable 4 1,016 203 813 812 Cash and marketable securities 5 250 22 228 260 Current assets 1,266 225 1,041 1,072 Prepayments and deferred charges 4 44 - 44 45 TOTAL ASSETS 38,396 1,968 36,428 36,510 Eauitv and liabilities Equity and liabilities (in miiiions of euros) Notes 2016 2015 Share capital 1,891 1,846 Issue and merger premiums 16,367 16,023 Legal reserve 184 184 Regulated reserves 378 378 Other reserves 39 39 Retained earnings 5,531 5,213 Net income for the year 433 831 Shareholders' eguitx 6 24,823 24,514 Provision for contingencies and charges 7 342 396 Financial liabilities Bonds 7,123 7,043 Bank borrowings - ' Operating liabilities Trade payables 26 33 Accrued taxes and payroll costs 106 74 Other operating liabilities 1 - Miscellaneous liabilities Other miscellaneous liabilities 4,007 4,450 Liabilities 8 11,263 11,600 TOTAL EQUITY AND LIABILITIES 36.428 36.510