

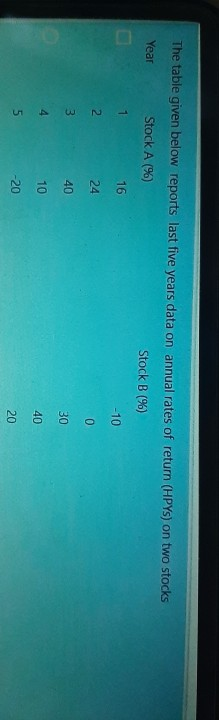
Question: calculate the ecpected rate The table given below reports last five years data on annual rates of return (HPY) on two stocks Stock A 190


calculate the ecpected rate
The table given below reports last five years data on annual rates of return (HPY) on two stocks Stock A 190 Stock B (96) -10 1 16 2 24 0 3 40 30 10 40 20 20 2 compute the stands BV 3. compute the coefficient of variation for each stock By this measure which stock is preferable calculate the Geometric Mean for both the stocks? Which stock is preferable by this measure Standard Deviation of stock B Choose None of these Geometric Mean of Stock A Choose From Coefficient of Variation point of view Stock A is preferable Arithmetic Mean of stock A Choose - Coefficient of Variation of Stock B From Arithmetic mean point of view Stock B is preferable False Choose . From standard deviation point of view Stock A is preferable False From geometric mean point of view Stock A is preferable The table given below reports last five years data on annual rates of return (HPYs) on two stocks Year Stock A (%) Stock B (%) 1 16 -10 2 24 0 3 40 30 4 10 40 w -20 20
Step by Step Solution
There are 3 Steps involved in it

Get step-by-step solutions from verified subject matter experts