

Question: Calculate the expected return on this stock based on the CAP-M equation and the actual average return of your stock over the past five years.
Calculate the expected return on this stock based on the CAP-M equation and the actual average return of your stock over the past five years. Please show work.
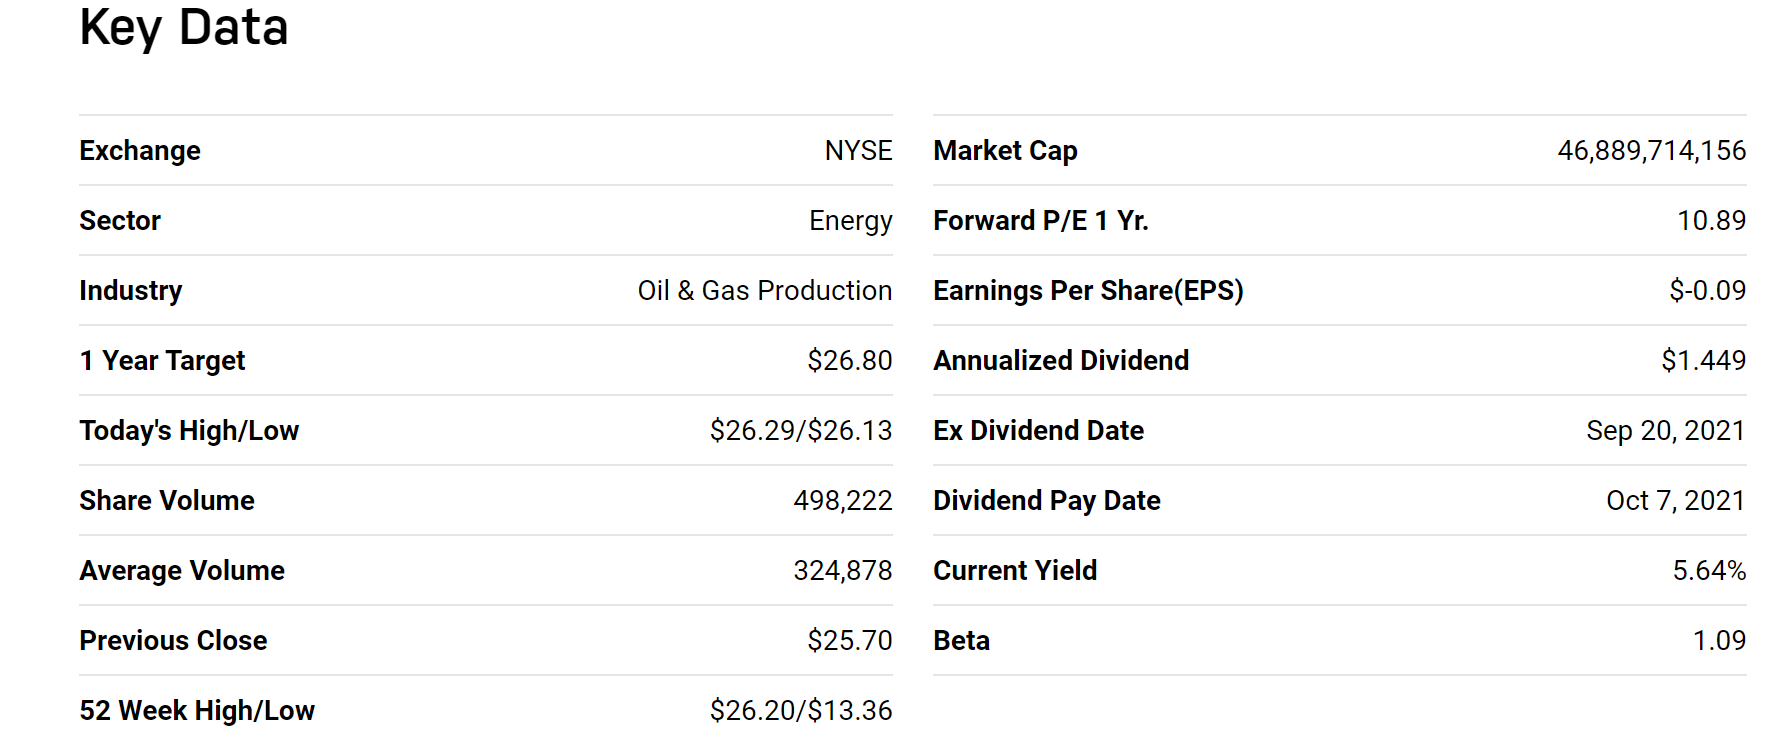
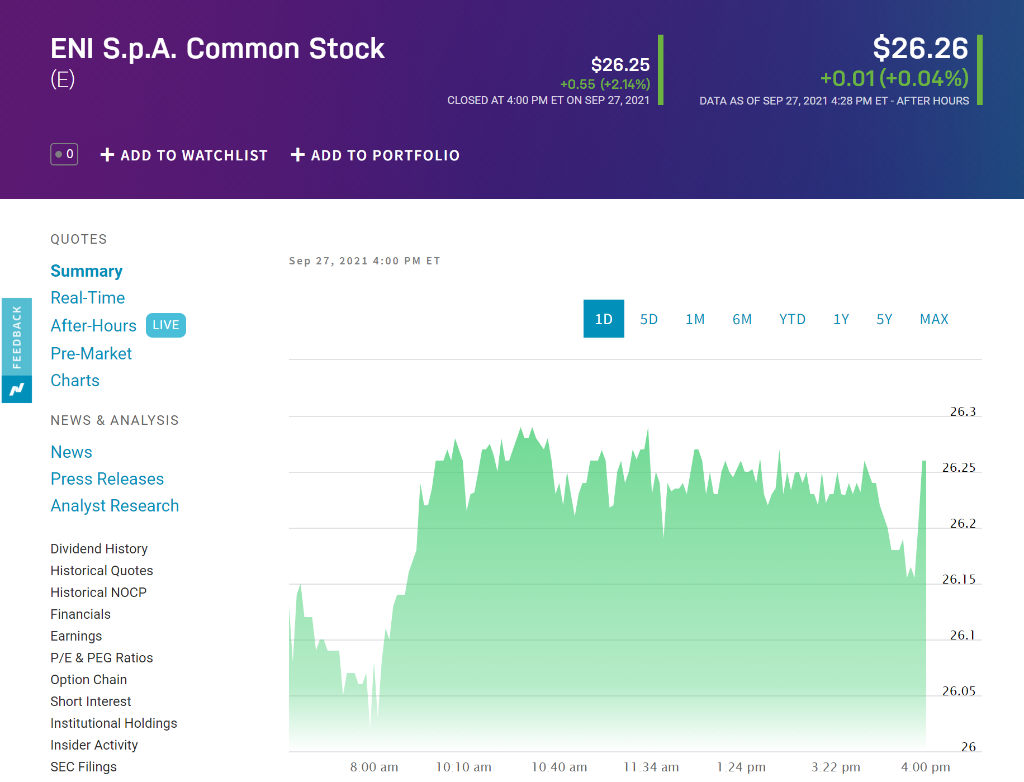
Key Data Exchange NYSE Market Cap 46,889,714,156 Sector Energy Forward P/E 1 Yr. 10.89 Industry Oil & Gas Production Earnings Per Share(EPS) $-0.09 1 Year Target $26.80 Annualized Dividend $1.449 Today's High/Low $26.29/$26.13 Ex Dividend Date Sep 20, 2021 Share Volume 498,222 Dividend Pay Date Oct 7, 2021 Average Volume 324,878 Current Yield 5.64% Previous Close $25.70 Beta 1.09 52 Week High/Low $26.20/$13.36 ENI S.p.A. Common Stock (E) $26.25 +0.55 (+2.14%) CLOSED AT 4:00 PM ET ON SEP 27, 2021 $26.26 +0.01(+0.04%) DATA AS OF SEP 27, 2021 4:28 PM ET - AFTER HOURS .0 + ADD TO WATCHLIST + ADD TO PORTFOLIO QUOTES Sep 27, 2021 4:00 PM ET Summary Real-Time After-Hours LIVE Pre-Market 1D 5D 1M 6M YTD 1Y 5Y MAX FEEDBACK Charts 26.3 NEWS & ANALYSIS 26.25 News Press Releases Analyst Research 26.2 26.15 26.1 Dividend History Historical Quotes Historical NOCP Financials Earnings P/E & PEG Ratios Option Chain Short Interest Institutional Holdings Insider Activity SEC Filings 26.05 26 8.00 am 10.10 am 10.40 am 11.34 am 1.24 pm 3.22 pm 4.00 pm Key Data Exchange NYSE Market Cap 46,889,714,156 Sector Energy Forward P/E 1 Yr. 10.89 Industry Oil & Gas Production Earnings Per Share(EPS) $-0.09 1 Year Target $26.80 Annualized Dividend $1.449 Today's High/Low $26.29/$26.13 Ex Dividend Date Sep 20, 2021 Share Volume 498,222 Dividend Pay Date Oct 7, 2021 Average Volume 324,878 Current Yield 5.64% Previous Close $25.70 Beta 1.09 52 Week High/Low $26.20/$13.36 ENI S.p.A. Common Stock (E) $26.25 +0.55 (+2.14%) CLOSED AT 4:00 PM ET ON SEP 27, 2021 $26.26 +0.01(+0.04%) DATA AS OF SEP 27, 2021 4:28 PM ET - AFTER HOURS .0 + ADD TO WATCHLIST + ADD TO PORTFOLIO QUOTES Sep 27, 2021 4:00 PM ET Summary Real-Time After-Hours LIVE Pre-Market 1D 5D 1M 6M YTD 1Y 5Y MAX FEEDBACK Charts 26.3 NEWS & ANALYSIS 26.25 News Press Releases Analyst Research 26.2 26.15 26.1 Dividend History Historical Quotes Historical NOCP Financials Earnings P/E & PEG Ratios Option Chain Short Interest Institutional Holdings Insider Activity SEC Filings 26.05 26 8.00 am 10.10 am 10.40 am 11.34 am 1.24 pm 3.22 pm 4.00 pm
Step by Step Solution
There are 3 Steps involved in it

Get step-by-step solutions from verified subject matter experts