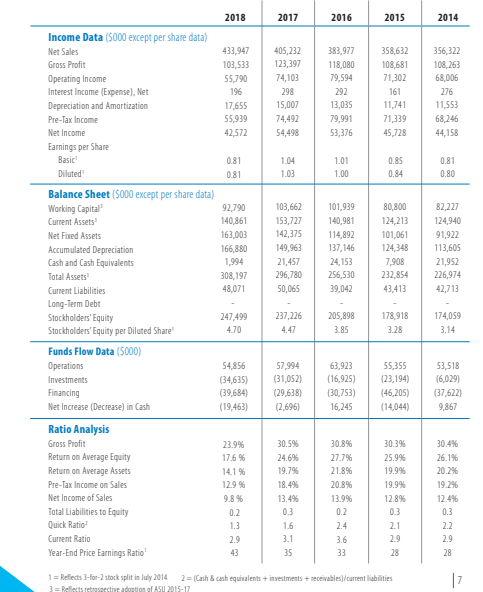
calculate the financial ratios for the company after analyzing the financial highlights. Income Data (5000 except per
Fantastic news! We've Found the answer you've been seeking!
Question:
Transcribed Image Text:
Income Data (5000 except per share data) 2018 2017 2016 2015 2014 Net Sales 433,947 405,232 383,977 358,632 356,322 Gross Profit 103,533 123,397 118,080 108,681 108,263 Operating Income 55,790 74,103 79,594 71,302 68,006 Interest Income (Expense), Net 196 298 292 161 276 Depreciation and Amortization 17,655 15,007 13,035 11,741 11,553 Pre-Tax Income 55,939 74,492 79,991 71,339 68,246 Net Income 42,572 54,498 53,376 45,728 44,158 Earnings per Share Basic 0.81 1.04 1.01 0.85 0.81 Diluted 0.81 1.03 1.00 0.84 0.80 Balance Sheet (5000 except per share data) Working Capital' 92,790 103,662 101,939 80,800 82,227 Current Assets 140,861 153,727 140,981 124,213 124,940 Net Fixed Assets 163,003 142,375 114,892 101,061 91,922 Accumulated Depreciation 166,880 149,963 137,146 124,348 113,605 Cash and Cash Equivalents 1,994 21,457 24,153 7,908 21,952 Total Assets 308,197 296,780 256,530 232,854 226,974 Current Liabilities 48,071 50,065 39,042 43,413 42,713 Long-Term Debt Stockholders' Equity 247,499 237,226 205,898 178,918 174,059 Stockholders' Equity per Diluted Share 4.70 4.47 3.85 3.28 3.14 Funds Flow Data (5000) Operations 54,856 57,994 63,923 55,355 53,518 Investments (34,635) (31,052) (16,925) (23,194) (6,029) Financing (39,684) (29,638) (30,753) (46,205) (37,622) Net Increase (Decrease) in Cash (19,463) (2,696) 16,245 (14,044) 9,867 Ratio Analysis Gross Profit 23.9% 30.5% 30.8% 30.3% 30.4% Return on Average Equity 17.6% 24.6% 27.7% 25.9% 26.1% Return on Average Assets 14.1% 19.7% 21.8% 19.9% 20.2% Pre-Tax Income on Sales 12.9 % 18.4% 20.8% 19.9% 19.2% Net Income of Sales 9.8% 13.4% 13.9% 12.8% 12.4% Total Liabilities to Equity 0.2 0.3 0.2 0.3 0.3 Quick Ratio 1.3 1.6 2.4 2.1 2.2 Current Ratio 2.9 3.1 3.6 2.9 2.9 Year-End Price Earnings Ratio" 43 35 33 28 28 1=Reflects 3-for-2 stock split in July 2014 2=(Cash & cash equivalents + investments + receivables)/current liabilities 3=Reflects retrospective adoption of ASU 2015-17 7 Income Data (5000 except per share data) 2018 2017 2016 2015 2014 Net Sales 433,947 405,232 383,977 358,632 356,322 Gross Profit 103,533 123,397 118,080 108,681 108,263 Operating Income 55,790 74,103 79,594 71,302 68,006 Interest Income (Expense), Net 196 298 292 161 276 Depreciation and Amortization 17,655 15,007 13,035 11,741 11,553 Pre-Tax Income 55,939 74,492 79,991 71,339 68,246 Net Income 42,572 54,498 53,376 45,728 44,158 Earnings per Share Basic 0.81 1.04 1.01 0.85 0.81 Diluted 0.81 1.03 1.00 0.84 0.80 Balance Sheet (5000 except per share data) Working Capital' 92,790 103,662 101,939 80,800 82,227 Current Assets 140,861 153,727 140,981 124,213 124,940 Net Fixed Assets 163,003 142,375 114,892 101,061 91,922 Accumulated Depreciation 166,880 149,963 137,146 124,348 113,605 Cash and Cash Equivalents 1,994 21,457 24,153 7,908 21,952 Total Assets 308,197 296,780 256,530 232,854 226,974 Current Liabilities 48,071 50,065 39,042 43,413 42,713 Long-Term Debt Stockholders' Equity 247,499 237,226 205,898 178,918 174,059 Stockholders' Equity per Diluted Share 4.70 4.47 3.85 3.28 3.14 Funds Flow Data (5000) Operations 54,856 57,994 63,923 55,355 53,518 Investments (34,635) (31,052) (16,925) (23,194) (6,029) Financing (39,684) (29,638) (30,753) (46,205) (37,622) Net Increase (Decrease) in Cash (19,463) (2,696) 16,245 (14,044) 9,867 Ratio Analysis Gross Profit 23.9% 30.5% 30.8% 30.3% 30.4% Return on Average Equity 17.6% 24.6% 27.7% 25.9% 26.1% Return on Average Assets 14.1% 19.7% 21.8% 19.9% 20.2% Pre-Tax Income on Sales 12.9 % 18.4% 20.8% 19.9% 19.2% Net Income of Sales 9.8% 13.4% 13.9% 12.8% 12.4% Total Liabilities to Equity 0.2 0.3 0.2 0.3 0.3 Quick Ratio 1.3 1.6 2.4 2.1 2.2 Current Ratio 2.9 3.1 3.6 2.9 2.9 Year-End Price Earnings Ratio" 43 35 33 28 28 1=Reflects 3-for-2 stock split in July 2014 2=(Cash & cash equivalents + investments + receivables)/current liabilities 3=Reflects retrospective adoption of ASU 2015-17 7
Expert Answer:
Answer rating: 100% (QA)
Certainly The provided data consists of financial information over a span of several years including ... View the full answer
Related Book For
Horngrens Financial and Managerial Accounting
ISBN: 978-0133255584
4th Edition
Authors: Tracie L. Nobles, Brenda L. Mattison, Ella Mae Matsumura
Posted Date:
Students also viewed these finance questions
-
Kaelea, Inc., has no debt outstanding and a total market value of $165,000. Earnings before interest and taxes, EBIT, are projected to be $9,900 if economic conditions are normal. If there is strong...
-
Use the attached "words.txt" file to store the words along with their ranks in an AVL tree. Then provide the user the option to search for any word. If the word exists the program displays the rank...
-
What is the square root of 3 to the square root of 2 power times the square root of 3 to the negative square root of 2 power?
-
In which of the following situations, a or b, is a tit-for-tat strategy more likely to be successful at maintaining cooperation? a. An agreement of mutual support between players on a reality...
-
In a recent annual report the chief executive officer of Kimberly-Clark outlined his plans as follows: We continue to address the elements under our control, focusing on areas critical to delivering...
-
The following are extracted from the balance sheets as at 31 March 2004 and 31 March 2005 of Glebe Ltd: Required: (a) Calculate for each of the two years two ratios that indicate the liquidity...
-
Sport Ready produces sports socks. The company has fixed expenses of $ 90,000 and variable expenses of $ 0.90 per package. Each package sells for $ 1.80. Requirements 1. Compute the contribution...
-
Triangle ABC has altitude h. B C a h x A D b y C Move the options to the spaces to complete the proof of the Law of Cosines. , which becomes By the definition of cosine and multiplication, y = a cos...
-
The seven tetrominos: they can be also named by the letter they resemble. The figure shows I (light blue), J (dark blue), O (yellow), L (orange), T (purple), S (green), Z (red). Your Java program...
-
what ways does cultural capital operate as a form of symbolic power that confers social status, distinction, and advantage in fields such as education, the arts, and the media ?
-
At the beginning of the year, Albertson Incorporated reports inventory of $6,900. During the year, the company purchases additional inventory for $21,900. At the end of the year, the cost of...
-
During the 20X8 tax year, Kricia completed her 2nd year as an undergraduate at Faber University. During the year, Kricia incurred the following expenses. Tuition: $40,000 Room and Board: 10,000...
-
How have different countries approached industrial policy? How does this historical discussion of industrial policy compare to the textbook's discussion of investment? Does the neoclassical idea of...
-
Explain why (2)( + 2) = 0 has no solutions.
-
Review the NAU Online Library tutorials,Tips & tricks for finding what you need quickly, andUsing keywords and subject terms, and NAU Online Library handout,Limiting to peer-reviewed articles in...
-
Select a mass spectrometric technique with the highest mass resolution for identifying an unknown compound being eluted from a liquid chromatography column
-
Study the format of the analysis of variances in Exhibit 12-12. Suppose production is 156,000 units. Also assume the following: Other data are as shown in Exhibit 12-12. Prepare an analysis of...
-
The following questions are based on the data contained in Exhibit 12-9. 1. Suppose actual production and sales were 8,000 units instead of 7,000 units. (a) Compute the sales-volume variance. Is the...
-
Belfair Kayak Company makes molded plastic kayaks. Standards costs for an entry-level whitewater kayak are: Direct materials, 60 kilograms @ $5.50 per kilogram Direct labour, 1.5 hours $16 per hour...
Study smarter with the SolutionInn App