

Question: Calculate the MAE, MSE, and the MAPE for the example mentioned in the book in table 6.7 ( Section 6.2). The 3 measurements should be
Calculate the MAE, MSE, and the MAPE for the example mentioned in the book in table 6.7 ( Section 6.2). The 3 measurements should be calculated as per the Naive method and the Average of the Past Values.
Calculate the MAE, MSE, and the MAPE for the example mentioned in the book in table 6.7 ( Section 6.2). The 3 measurements should be calculated as per the Naive method and the Average of the Past Values.
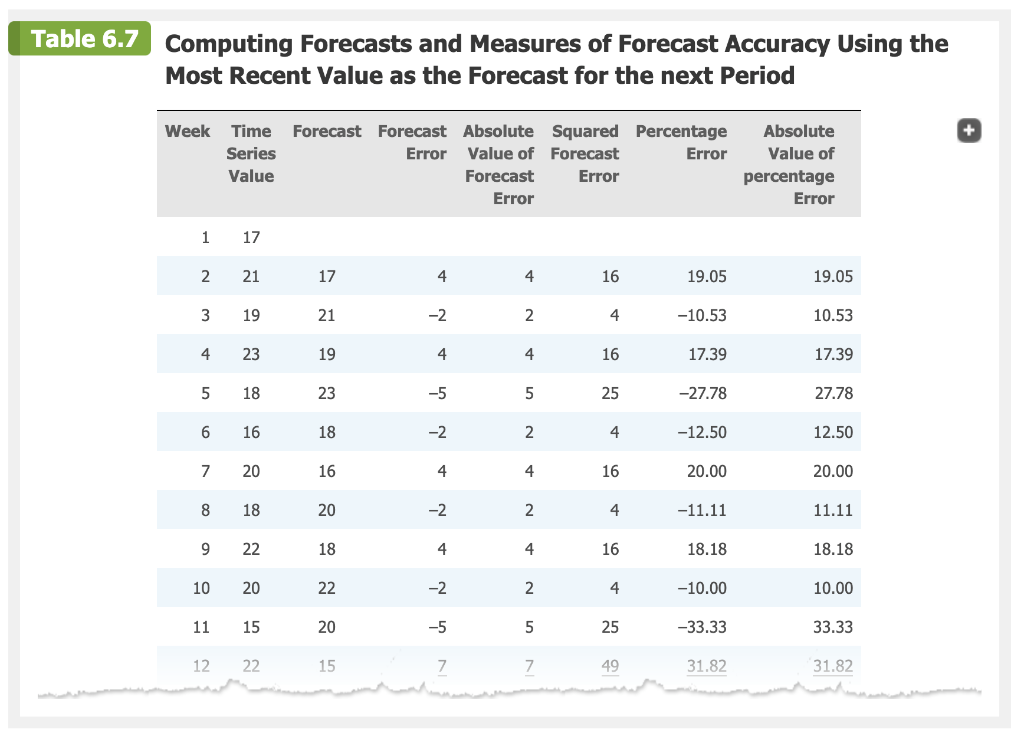
Table 6.7 Computing Forecasts and Measures of Forecast Accuracy Using the Most Recent Value as the Forecast for the next Period Week Time Series Value Forecast forecast Absolute Squared Percentage Error Value of Forecast Error Forecast Error Error Absolute Value of percentage Error 1 17 2 21 17 4 4 16 19.05 19.05 3 19 21 -2 2 4 -10.53 10.53 4 23 19 4 4 16 17.39 17.39 5 18 23 -5 5 25 -27.78 27.78 6 16 18 -2 2. 4 -12.50 12.50 7 20 16 4 4 16 20.00 20.00 8 18 20 -2 2 2. 4 -11.11 11.11 9 22 18 4 4 16 18.18 18.18 10 20 22 -2 2 4 -10.00 10.00 11 15 20 -5 5 25 -33.33 33.33 12 22 15 7 7 49 31.82 31.82Step by Step Solution
There are 3 Steps involved in it
1 Expert Approved Answer
Step: 1 Unlock

Question Has Been Solved by an Expert!
Get step-by-step solutions from verified subject matter experts
Step: 2 Unlock
Step: 3 Unlock