

Question: calculate the missing information in the table found in the Excel spreadsheet that accompanies the case using weights of portfolio A & B in 10
calculate the missing information in the table found in the Excel spreadsheet that accompanies the case using weights of portfolio A & B in 10 percentage point increments.** show formulas
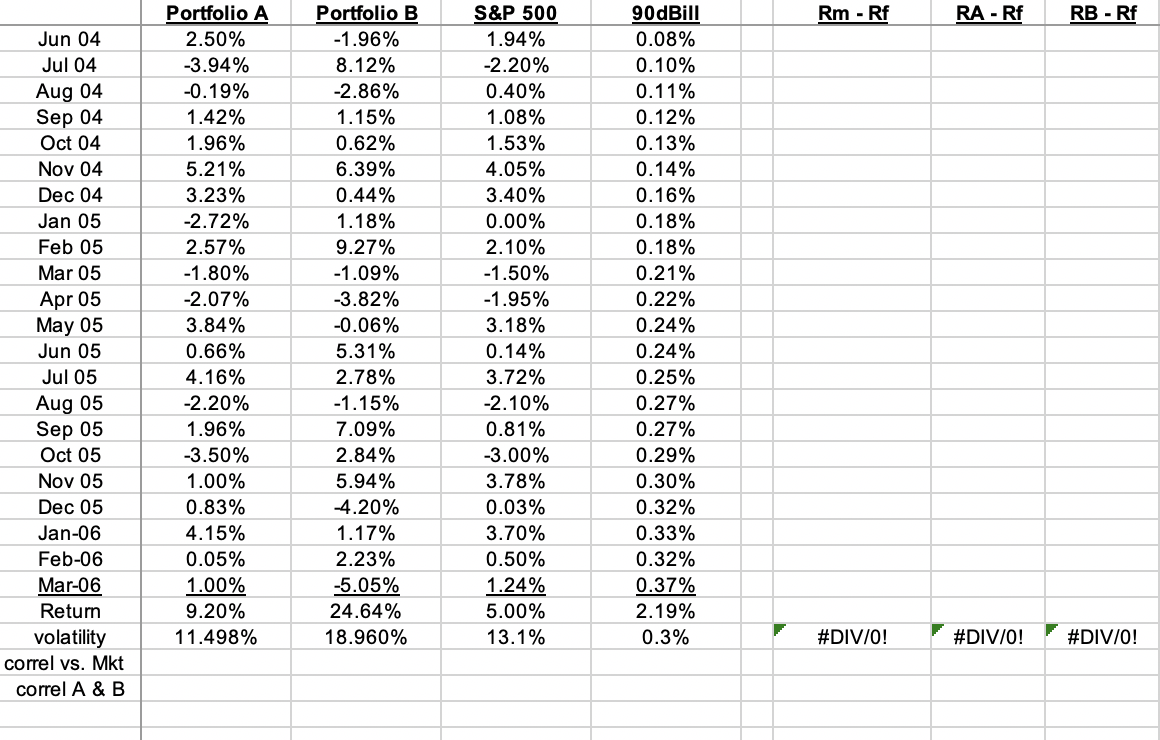
Rm - Rf RA - Rf RB - Rf Jun 04 Jul 04 Aug 04 Sep 04 Oct 04 Nov 04 Dec 04 Jan 05 Feb 05 Mar 05 Apr 05 May 05 Jun 05 Jul 05 Aug 05 Sep 05 Oct 05 Nov 05 Dec 05 Jan-06 Feb-06 Mar-06 Return volatility correl vs. Mkt correl A & B Portfolio A 2.50% -3.94% -0.19% 1.42% 1.96% 5.21% 3.23% -2.72% 2.57% -1.80% -2.07% 3.84% 0.66% 4.16% -2.20% 1.96% -3.50% 1.00% 0.83% 4.15% 0.05% 1.00% 9.20% 11.498% Portfolio B -1.96% 8.12% -2.86% 1.15% 0.62% 6.39% 0.44% 1.18% 9.27% -1.09% -3.82% -0.06% 5.31% 2.78% -1.15% 7.09% 2.84% 5.94% -4.20% 1.17% 2.23% -5.05% 24.64% 18.960% S&P 500 1.94% -2.20% 0.40% 1.08% 1.53% 4.05% 3.40% 0.00% 2.10% -1.50% -1.95% 3.18% 0.14% 3.72% -2.10% 0.81% -3.00% 3.78% 0.03% 3.70% 0.50% 1.24% 5.00% 13.1% 90dBill 0.08% 0.10% 0.11% 0.12% 0.13% 0.14% 0.16% 0.18% 0.18% 0.21% 0.22% 0.24% 0.24% 0.25% 0.27% 0.27% 0.29% 0.30% 0.32% 0.33% 0.32% 0.37% 2.19% 0.3% #DIV/0! #DIV/0! #DIV/0
Step by Step Solution
There are 3 Steps involved in it

Get step-by-step solutions from verified subject matter experts