

Calculate the nominal and real annual rate of housing price appreciation rate for Miami and for Houston
Fantastic news! We've Found the answer you've been seeking!
Question:
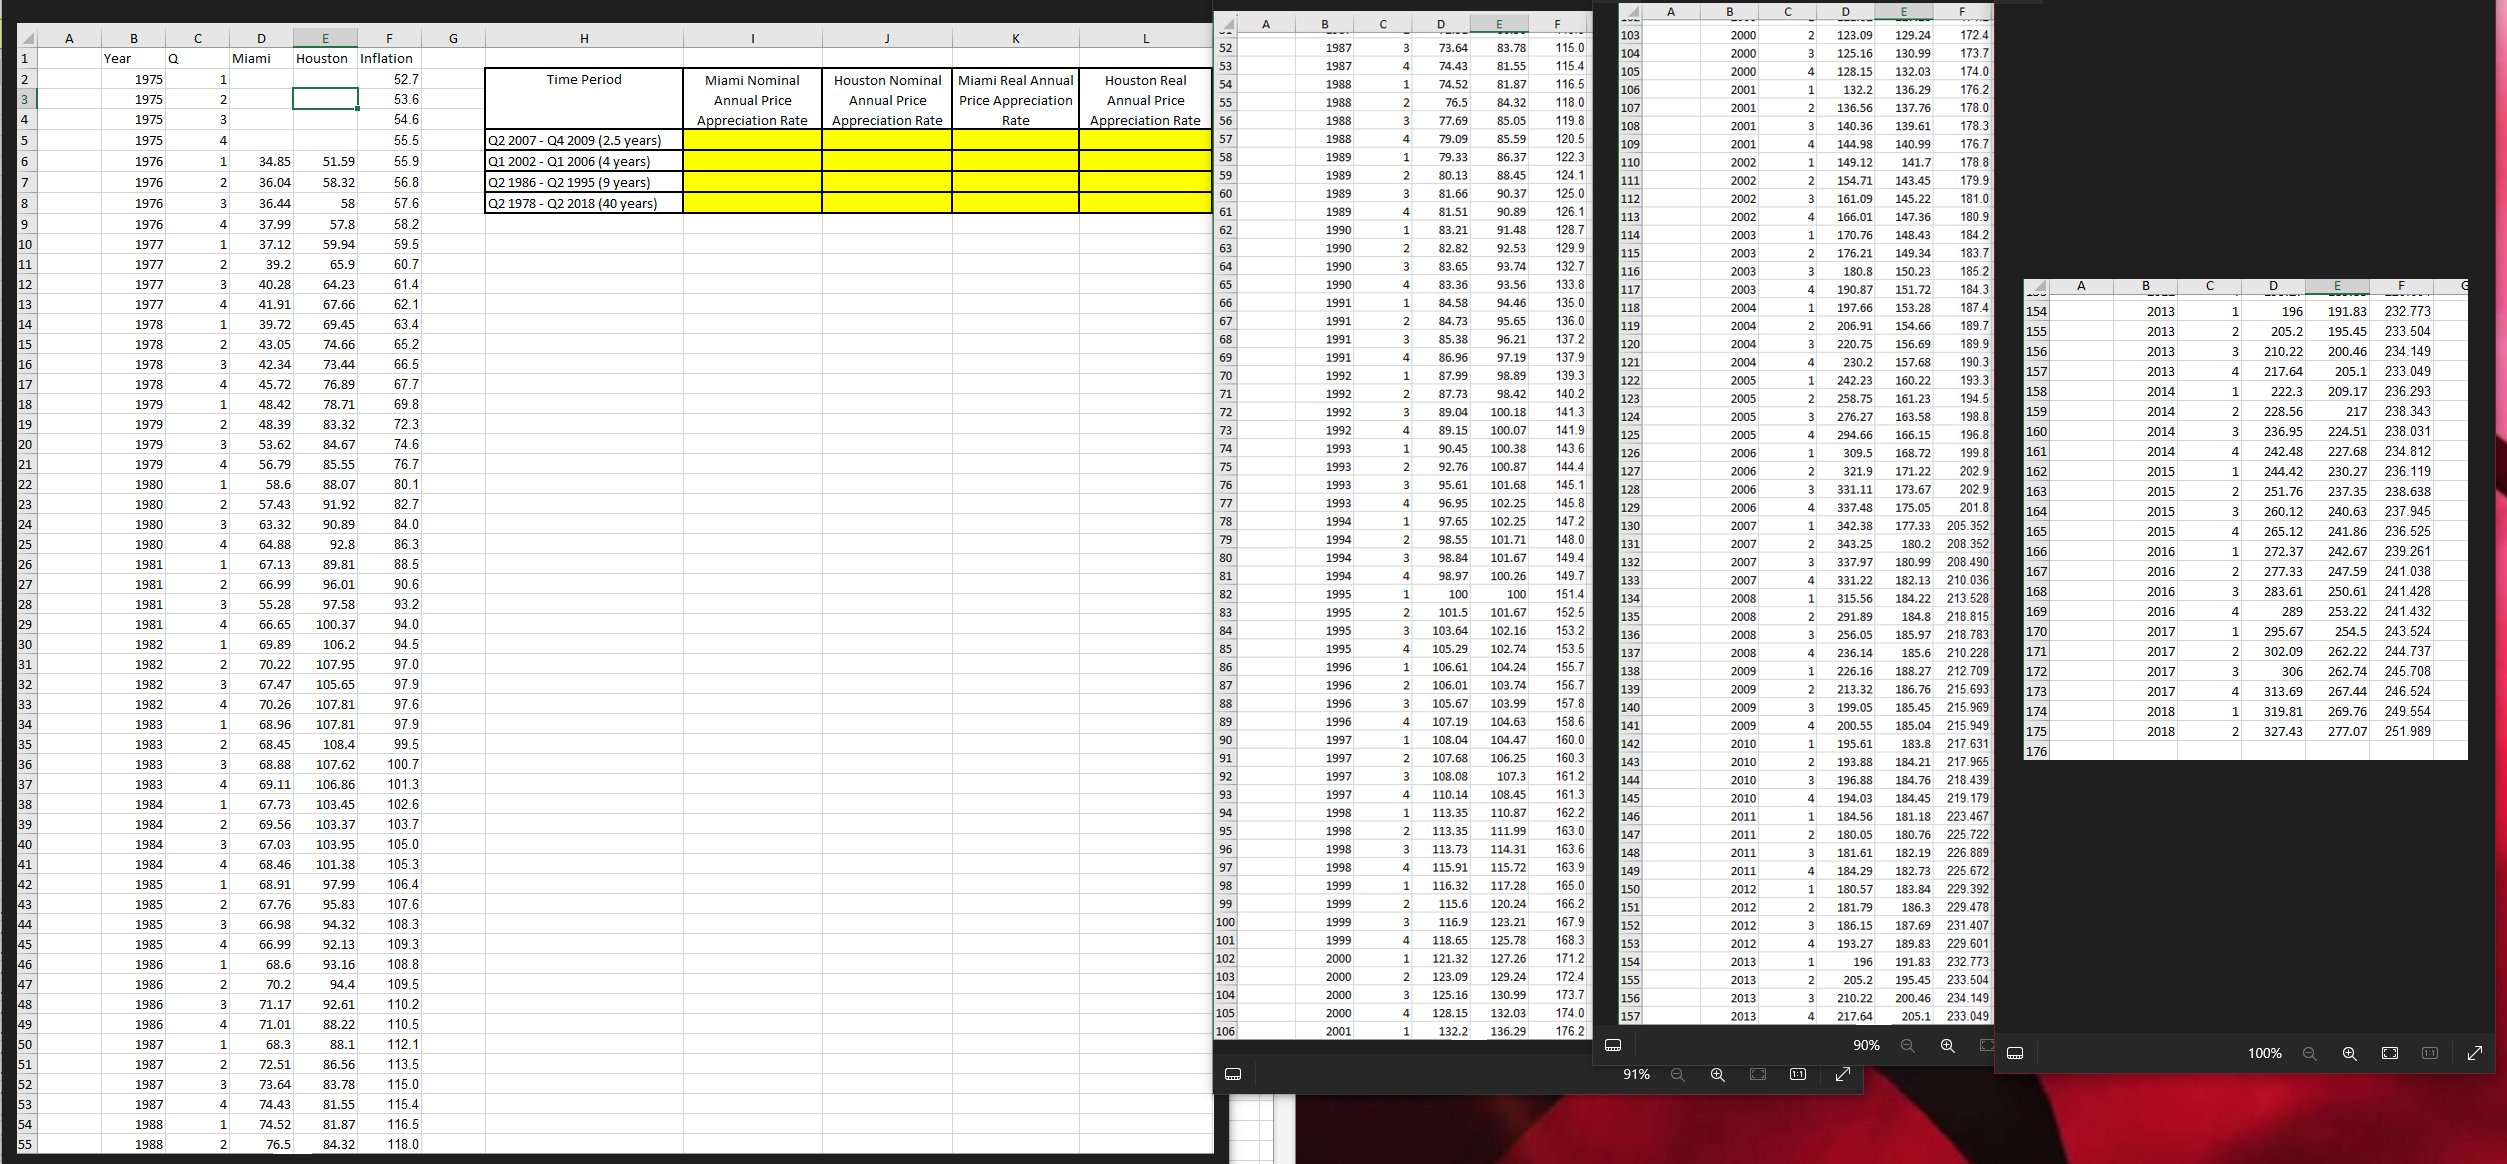
Calculate the nominal and real annual rate of housing price appreciation rate for Miami and for Houston for the requested different time periods using the housing price index data and the inflation index data provided to you in tab A ?of the Excel spreadsheet.
a ?In total, you need to calculate ?values that will appear in the ?yellow cells of that Excel tab.
bWhat can you say about the magnitude and the volatility of housing price appreciation in the short, medium and long run?
Transcribed Image Text:
A B D E F 4 A B D 103 2000 2 123.09 129.24 172.4 2 1 A Year B 1975 Q C Miami D F G H 52 1987 3 73.64 83.78 115.0 104 2000 3 125.16 130.99 173.7 Houston Inflation 53 1987 4 74.43 81.55 115.4 105 2000 4 128.15 132.03 174.0 1 52.7 Time Period Miami Nominal 3 1975 2 53.6 4 1975 3 54.6 Annual Price Appreciation Rate Houston Nominal Annual Price Appreciation Rate Miami Real Annual Price Appreciation Rate Houston Real 54 1988 1 74.52 81.87 116.5 106 2001 1 132.2 136.29 176.2 Annual Price 55 1988 2 76.5 84.32 118.0 107 2001 2 136.56 137.76 178.0 Appreciation Rate 56 1988 3 77.69 85.05 119.8 108 2001 3 140.36 139.61 178.3 5 1975 4 55.5 Q2 2007 Q4 2009 (2.5 years) 57 1988 4 79.09 85.59 120.5 109 2001 4 144.98 140.99 176.7 58 1989 1 79.33 86.37 122.3 6 1976 1 34.85 51.59 55.9 Q1 2002-Q1 2006 (4 years) 110 2002 1 149.12 141.7 178.8 59 1989 2 80.13 88.45 124.1 7 1976 2 36.04 58.32 56.8 Q2 1986 Q2 1995 (9 years) 111 2002 2 154.71 143.45 179.9 60 1989 3 81.66 90.37 125.0 112 2002 3 161.09 145.22 181.0 8 1976 3 36.44 58 57.6 Q2 1978 Q2 2018 (40 years) 61 1989 4 81.51 90.89 126.1 113 2002 4 166.01 147.36 180.9 9 1976 4 37.99 57.8 58.2 62 1990 1 83.21 91.48 128.7 114 2003 1 170.76 148.43 184.2 10 1977 1 37.12 59.94 59.5 63 1990 2 82.82 92.53 129.9 115 2003 2 176.21 149.34 183.7 11 1977 2 39.2 65.9 60.7 64 1990 3 83.65 93.74 132.7 116 2003 3 180.8 150.23 185.2 12 1977 3 40.28 64.23 61.4 65 1990 4 83.36 93.56 133.8 117 2003 4 190.87 151.72 184.3 A B C D 13 1977 4 41.91 67.66 62.1 66 1991 1 84.58 94.46 135.0 118 2004 1 197.66 153.28 187.4 154 2013 1 196 191.83 232.773 67 1991 2 84.73 95.65 136.0 14 1978 1 39.72 69.45 63.4 119 2004 2 206.91 154.66 189.7 155 2013 2 205.2 195.45 233.504 68 1991 3 85.38 96.21 137.2 15 1978 2 43.05 120 2004 3 220.75 156.69 189.9 74.66 65.2 156 2013 3 210.22 200.46 234.149 69 1991 4 86.96 97.19 137.9 121 2004 4 230.2 157.68 190.3 16 1978 3 42.34 73.44 66.5 70 1992 1 87.99 98.89 139.3 157 2013 4 217.64 205.1 233.049 122 2005 1 242.23 160.22 193.3 17 1978 4 45.72 76.89 67.7 71 1992 2 87.73 98.42 140.2 158 2014 1 222.3 123 2005 2 258.75 161.23 194.5 18 1979 1 48.42 78.71 69.8 72 1992 3 89.04 100.18 141.3 159 2014 2 228.56 124 2005 3 276.27 163.58 198.8 19 1979 2 48.39 83.32 72.3 73 1992 4 89.15 100.07 141.9 125 2005 20 1979 3 53.62 84.67 74.6 74 1993 1 90.45 100.38 143.6 126 2006 4 1 294.66 166.15 196.8 160 2014 3 309.5 168.72 199.8 161 2014 4 242.48 21 1979 4 56.79 85.55 76.7 75 1993 2 92.76 100.87 144.4 127 2006 2 321.9 171.22 202.9 162 2015 1 22 1980 1 58.6 88.07 80.1 76 1993 3 95.61 101.68 145.1 128 2006 3 331.11 173.67 202.9 163 2015 23 1980 2 57.43 91.92 77 82.7 1993 4 96.95 102.25 145.8 129 2006 4 337.48 175.05 201.8 164 2015 78 1994 1 97.65 102.25 147.2 24 1980 3 63.32 90.89 84.0 130 2007 1 342.38 177.33 205.352 165 2015 4 79 1994 2 98.55 101.71 148.0 25 1980 4 64.88 92.8 86.3 131 2007 2 343.25 180.2 208.352 166 2016 236.293 217 238.343 224.51 236.95 227.68 234.812 244.42 230.27 236.119 2 251.76 237.35 238.638 3 260.12 240.63 237.945 265.12 241.86 236.525 1 272.37 242.67 239.261 209.17 238.031 80 1994 3 98.84 101.67 149.4 132 2007 3 337.97 180.99 208.490 26 1981 1 67.13 89.81 88.5 167 2016 81 1994 4 98.97 100.26 149.7 133 2007 4 331.22 182.13 210.036 27 1981 2 66.99 96.01 90.6 82 1995 1 100 100 151.4 168 2016 2 277.33 3 283.61 247.59 241.038 250.61 241.428 134 2008 1 315.56 28 1981 3 55.28 97.58 93.2 83 1995 2 101.5 101.67 152.5 135 2008 29 1981 4 66.65 100.37 94.0 84 1995 3 103.64 102.16 153.2 136 2008 2 291.89 3 256.05 30 1982 1 69.89 106.2 94.5 85 1995 4 105.29 102.74 153.5 137 2008 4 236.14 31 1982 2 70.22 107.95 97.0 86 1996 1 106.61 104.24 155.7 138 2009 1 226.16 32 1982 3 67.47 105.65 97.9 87 1996 2 106.01 103.74 156.7 139 2009 2 213.32 33 1982 4 70.26 107.81 97.6 88 1996 3 105.67 103.99 157.8 140 2009 3 199.05 184.22 213.528 218.815 184.8 218.783 185.97 185.6 210.228 188.27 212.709 186.76 215.693 185.45 215.969 169 170 171 172 2016 4 289 253.22 241.432 2017 1 295.67 254.5 243.524 2017 173 2017 2017 2 3 302.09 262.22 244.737 306 4 313.69 262.74 245.708 267.44 246.524 174 2018 1 319.81 269.76 249.554 89 1996 4 107.19 104.63 158.6 34 1983 1 68.96 107.81 97.9 141 2009 90 1997 1 108.04 104.47 160.0 142 2010 4 200.55 185.04 215.949 1 195.61 183.8 217.631 35 1983 2 68.45 108.4 99.5 175 176 2018 2 327.43 277.07 251.989 91 1997 2 107.68 106.25 160.3 143 2010 2 193.88 184.21 217.965 36 1983 3 68.88 107.62 100.7 92 1997 3 108.08 107.3 161.2 144 2010 3 37 1983 4 69.11 106.86 101.3 93 1997 4 110.14 108.45 161.3 145 2010 38 1984 1 67.73 103.45 102.6 94 1998 1 113.35 110.87 162.2 146 2011 39 1984 2 69.56 103.37 103.7 95 1998 2 113.35 111.99 163.0 147 2011 40 1984 3 67.03 103.95 105.0 96 1998 3 113.73 114.31 163.6 148 2011 3 41 1984 4 68.46 101.38 105.3 97 1998 4 115.91 115.72 163.9 149 2011 42 1985 1 68.91 97.99 106.4 98 1999 1 116.32 117.28 165.0 150 2012 43 1985 2 67.76 95.83 107.6 99 1999 2 115.6 120.24 166.2 151 2012 100 1999 3 116.9 123.21 167.9 44 1985 3 66.98 94.32 108.3 152 2012 196.88 184.76 218.439 4 194.03 184.45 219.179 1 184.56 181.18 223.467 2 180.05 181.61 182.19 226.889 4 184.29 182.73 225.672 1 180.57 183.84 229.392 186.3 229.478 2 181.79 3 186.15 187.69 231.407 180.76 225.722 101 1999 4 118.65 125.78 168.3 45 1985 4 66.99 153 2012 4 193.27 189.83 229.601 92.13 109.3 102 2000 1 121.32 127.26 171.2 154 2013 1 196 191.83 232.773 46 1986 1 68.6 93.16 108.8 103 2000 2 123.09 129.24 172.4 155 2013 2 47 1986 2 70.2 94.4 109.5 104 2000 3 125.16 130.99 173.7 156 2013 3 48 1986 3 71.17 92.61 110.2 105 2000 4 128.15 132.03 174.0 157 2013 49 1986 4 71.01 88.22 110.5 106 2001 1 132.2 136.29 176.2 50 1987 1 68.3 88.1 112.1 O 205.2 195.45 233.504 210.22 200.46 234.149 4 217.64 90% Q 205.1 233.049 100% + 1:1 51 1987 2 72.51 86.56 113.5 91% Q + [1:1] 52 1987 3 73.64 83.78 115.0 53 1987 4 74.43 81.55 115.4 54 1988 1 74.52 81.87 116.5 55 1988 2 76.5 84.32 118.0 A B D E F 4 A B D 103 2000 2 123.09 129.24 172.4 2 1 A Year B 1975 Q C Miami D F G H 52 1987 3 73.64 83.78 115.0 104 2000 3 125.16 130.99 173.7 Houston Inflation 53 1987 4 74.43 81.55 115.4 105 2000 4 128.15 132.03 174.0 1 52.7 Time Period Miami Nominal 3 1975 2 53.6 4 1975 3 54.6 Annual Price Appreciation Rate Houston Nominal Annual Price Appreciation Rate Miami Real Annual Price Appreciation Rate Houston Real 54 1988 1 74.52 81.87 116.5 106 2001 1 132.2 136.29 176.2 Annual Price 55 1988 2 76.5 84.32 118.0 107 2001 2 136.56 137.76 178.0 Appreciation Rate 56 1988 3 77.69 85.05 119.8 108 2001 3 140.36 139.61 178.3 5 1975 4 55.5 Q2 2007 Q4 2009 (2.5 years) 57 1988 4 79.09 85.59 120.5 109 2001 4 144.98 140.99 176.7 58 1989 1 79.33 86.37 122.3 6 1976 1 34.85 51.59 55.9 Q1 2002-Q1 2006 (4 years) 110 2002 1 149.12 141.7 178.8 59 1989 2 80.13 88.45 124.1 7 1976 2 36.04 58.32 56.8 Q2 1986 Q2 1995 (9 years) 111 2002 2 154.71 143.45 179.9 60 1989 3 81.66 90.37 125.0 112 2002 3 161.09 145.22 181.0 8 1976 3 36.44 58 57.6 Q2 1978 Q2 2018 (40 years) 61 1989 4 81.51 90.89 126.1 113 2002 4 166.01 147.36 180.9 9 1976 4 37.99 57.8 58.2 62 1990 1 83.21 91.48 128.7 114 2003 1 170.76 148.43 184.2 10 1977 1 37.12 59.94 59.5 63 1990 2 82.82 92.53 129.9 115 2003 2 176.21 149.34 183.7 11 1977 2 39.2 65.9 60.7 64 1990 3 83.65 93.74 132.7 116 2003 3 180.8 150.23 185.2 12 1977 3 40.28 64.23 61.4 65 1990 4 83.36 93.56 133.8 117 2003 4 190.87 151.72 184.3 A B C D 13 1977 4 41.91 67.66 62.1 66 1991 1 84.58 94.46 135.0 118 2004 1 197.66 153.28 187.4 154 2013 1 196 191.83 232.773 67 1991 2 84.73 95.65 136.0 14 1978 1 39.72 69.45 63.4 119 2004 2 206.91 154.66 189.7 155 2013 2 205.2 195.45 233.504 68 1991 3 85.38 96.21 137.2 15 1978 2 43.05 120 2004 3 220.75 156.69 189.9 74.66 65.2 156 2013 3 210.22 200.46 234.149 69 1991 4 86.96 97.19 137.9 121 2004 4 230.2 157.68 190.3 16 1978 3 42.34 73.44 66.5 70 1992 1 87.99 98.89 139.3 157 2013 4 217.64 205.1 233.049 122 2005 1 242.23 160.22 193.3 17 1978 4 45.72 76.89 67.7 71 1992 2 87.73 98.42 140.2 158 2014 1 222.3 123 2005 2 258.75 161.23 194.5 18 1979 1 48.42 78.71 69.8 72 1992 3 89.04 100.18 141.3 159 2014 2 228.56 124 2005 3 276.27 163.58 198.8 19 1979 2 48.39 83.32 72.3 73 1992 4 89.15 100.07 141.9 125 2005 20 1979 3 53.62 84.67 74.6 74 1993 1 90.45 100.38 143.6 126 2006 4 1 294.66 166.15 196.8 160 2014 3 309.5 168.72 199.8 161 2014 4 242.48 21 1979 4 56.79 85.55 76.7 75 1993 2 92.76 100.87 144.4 127 2006 2 321.9 171.22 202.9 162 2015 1 22 1980 1 58.6 88.07 80.1 76 1993 3 95.61 101.68 145.1 128 2006 3 331.11 173.67 202.9 163 2015 23 1980 2 57.43 91.92 77 82.7 1993 4 96.95 102.25 145.8 129 2006 4 337.48 175.05 201.8 164 2015 78 1994 1 97.65 102.25 147.2 24 1980 3 63.32 90.89 84.0 130 2007 1 342.38 177.33 205.352 165 2015 4 79 1994 2 98.55 101.71 148.0 25 1980 4 64.88 92.8 86.3 131 2007 2 343.25 180.2 208.352 166 2016 236.293 217 238.343 224.51 236.95 227.68 234.812 244.42 230.27 236.119 2 251.76 237.35 238.638 3 260.12 240.63 237.945 265.12 241.86 236.525 1 272.37 242.67 239.261 209.17 238.031 80 1994 3 98.84 101.67 149.4 132 2007 3 337.97 180.99 208.490 26 1981 1 67.13 89.81 88.5 167 2016 81 1994 4 98.97 100.26 149.7 133 2007 4 331.22 182.13 210.036 27 1981 2 66.99 96.01 90.6 82 1995 1 100 100 151.4 168 2016 2 277.33 3 283.61 247.59 241.038 250.61 241.428 134 2008 1 315.56 28 1981 3 55.28 97.58 93.2 83 1995 2 101.5 101.67 152.5 135 2008 29 1981 4 66.65 100.37 94.0 84 1995 3 103.64 102.16 153.2 136 2008 2 291.89 3 256.05 30 1982 1 69.89 106.2 94.5 85 1995 4 105.29 102.74 153.5 137 2008 4 236.14 31 1982 2 70.22 107.95 97.0 86 1996 1 106.61 104.24 155.7 138 2009 1 226.16 32 1982 3 67.47 105.65 97.9 87 1996 2 106.01 103.74 156.7 139 2009 2 213.32 33 1982 4 70.26 107.81 97.6 88 1996 3 105.67 103.99 157.8 140 2009 3 199.05 184.22 213.528 218.815 184.8 218.783 185.97 185.6 210.228 188.27 212.709 186.76 215.693 185.45 215.969 169 170 171 172 2016 4 289 253.22 241.432 2017 1 295.67 254.5 243.524 2017 173 2017 2017 2 3 302.09 262.22 244.737 306 4 313.69 262.74 245.708 267.44 246.524 174 2018 1 319.81 269.76 249.554 89 1996 4 107.19 104.63 158.6 34 1983 1 68.96 107.81 97.9 141 2009 90 1997 1 108.04 104.47 160.0 142 2010 4 200.55 185.04 215.949 1 195.61 183.8 217.631 35 1983 2 68.45 108.4 99.5 175 176 2018 2 327.43 277.07 251.989 91 1997 2 107.68 106.25 160.3 143 2010 2 193.88 184.21 217.965 36 1983 3 68.88 107.62 100.7 92 1997 3 108.08 107.3 161.2 144 2010 3 37 1983 4 69.11 106.86 101.3 93 1997 4 110.14 108.45 161.3 145 2010 38 1984 1 67.73 103.45 102.6 94 1998 1 113.35 110.87 162.2 146 2011 39 1984 2 69.56 103.37 103.7 95 1998 2 113.35 111.99 163.0 147 2011 40 1984 3 67.03 103.95 105.0 96 1998 3 113.73 114.31 163.6 148 2011 3 41 1984 4 68.46 101.38 105.3 97 1998 4 115.91 115.72 163.9 149 2011 42 1985 1 68.91 97.99 106.4 98 1999 1 116.32 117.28 165.0 150 2012 43 1985 2 67.76 95.83 107.6 99 1999 2 115.6 120.24 166.2 151 2012 100 1999 3 116.9 123.21 167.9 44 1985 3 66.98 94.32 108.3 152 2012 196.88 184.76 218.439 4 194.03 184.45 219.179 1 184.56 181.18 223.467 2 180.05 181.61 182.19 226.889 4 184.29 182.73 225.672 1 180.57 183.84 229.392 186.3 229.478 2 181.79 3 186.15 187.69 231.407 180.76 225.722 101 1999 4 118.65 125.78 168.3 45 1985 4 66.99 153 2012 4 193.27 189.83 229.601 92.13 109.3 102 2000 1 121.32 127.26 171.2 154 2013 1 196 191.83 232.773 46 1986 1 68.6 93.16 108.8 103 2000 2 123.09 129.24 172.4 155 2013 2 47 1986 2 70.2 94.4 109.5 104 2000 3 125.16 130.99 173.7 156 2013 3 48 1986 3 71.17 92.61 110.2 105 2000 4 128.15 132.03 174.0 157 2013 49 1986 4 71.01 88.22 110.5 106 2001 1 132.2 136.29 176.2 50 1987 1 68.3 88.1 112.1 O 205.2 195.45 233.504 210.22 200.46 234.149 4 217.64 90% Q 205.1 233.049 100% + 1:1 51 1987 2 72.51 86.56 113.5 91% Q + [1:1] 52 1987 3 73.64 83.78 115.0 53 1987 4 74.43 81.55 115.4 54 1988 1 74.52 81.87 116.5 55 1988 2 76.5 84.32 118.0
Expert Answer:

Related Book For 

The Economics Of Money Banking And Financial Markets
ISBN: 9780321584717
4th Canadian Edition
Authors: Frederic S. Mishkin, Apostolos Serletis
Posted Date:
Students also viewed these finance questions
-
This assignment requires you to complete the 2022 tax reporting for a fictional woman named Anna Smith. Question 1 T1 - step 4 - line 66 This is Anna's taxable income Answer: Question 2 T1 - step...
-
What theoretical relationship should there be between the standard deviation in Problem 6.48 and the standard deviation in Problem 6.49? Table 6.2: Sample of birth-weights (oz) obtained from 1000...
-
Margaret Magee has served both as an outside director to Maxcor Manufacturing since 2007 and as a member of the companys compensation committee since 2011. Margaret has been reviewing Maxcors 2014...
-
Calculate the current ratio, the acid-test ratio, the debt-to-equity ratio, and times interest earned for 2014 and 2015.Assume that Great Oaks Furniture was applying for a business loan and you are...
-
Consider a linear 2D compound parabolic concentrator built from parabolas tilted at 10 to the vertical, with a trough of width 3 m, and an absorber width of 0.5 m. Compute the concentration C of the...
-
Plaintiff visited South Chicago on January 10, 2008, seeking a new 2008 Nissan Versa (Versa) with manual transmission, anti-lock brakes, and other features. He was told by the employees of South...
-
The comparative balance sheet of Green Earth Lawn and Garden Inc. for December 31, 2008 and 2009, is as follows: Dec. 31, 2009 Dec. 31, 2008 Assets The income statement for the year ended December...
-
data in Range N 6 : Y 4 3 describes NFL quarterback ( QB ) statistics for the 2 0 1 3 season. Write different formulas for the following questions. Name Team G QBRat Comp Att Pct Yds Y / G Y / A TD...
-
Saddleback Company makes camping lanterns using a single production process. All direct materials are added at the beginning of the manufacturing process. Information for the month of March follows:...
-
Traditional Bank has an issue of preferred stock with an annual dividend of $7.50 that just sold for $62 a share. What is the bank's cost of preferred stock?
-
What are the philosophical, ethical, and legal implications of defining and protecting species diversity, including debates surrounding the intrinsic value of species, the rights of non-human...
-
The 7 percent preferred stock of Midwest Muffler and Towing is selling for $65 per share. What is the firm's cost of preferred stock if the tax rate is 21 percent and the par value per share is $100?
-
What Are the Types of Accounting Practices? Why Is Accounting Important in business?
-
The common stock of CTI has an expected return of 14.48 percent. The return on the market is 11.6 percent and the risk-free rate of return is 3.42 percent. What is the beta of this stock?
-
You are tasked with finding out whether the ice on Pluto or in Antarctica can produce more water. Pluto has a mass of 1.2710^22 kg and contains about 30% ice. Assume that the density of this ice is...
-
What are the before image (BFIM) and after image (AFIM) of a data item? What is the difference between in-place updating and shadowing, with respect to their handling of BFIM and AFIM?
-
We have discussed various stock markets in detail throughout this text. Another market that is less well known is the TSX Venture Exchange. Here contracts on a wide variety of commodities are traded...
-
If the point describing the combination of interest rate and aggregate output is not on either the IS or the LM curve, the economy will have no tendency to head toward the intersection of the...
-
What are the financial implications of a firm with a high default risk?
-
Predictions of future technological advances and breakthroughs are notoriously unreliable. For example, in the 1960 some futurists predicted that we would all soon be commuting to work in our own...
-
What overriding goal should every systems designer, in performing input design, never lose sight of?
-
Despite the inroads being made by other input methods, the venerable keyboard is still far and away the most common method used for data input, and it is likely to stay that way for a while. But...

Study smarter with the SolutionInn App