

Question: Calculate the probability for the following values assuming a normal distribution. Round the calculated z-statistic to 2 decimal places before using the standard normal
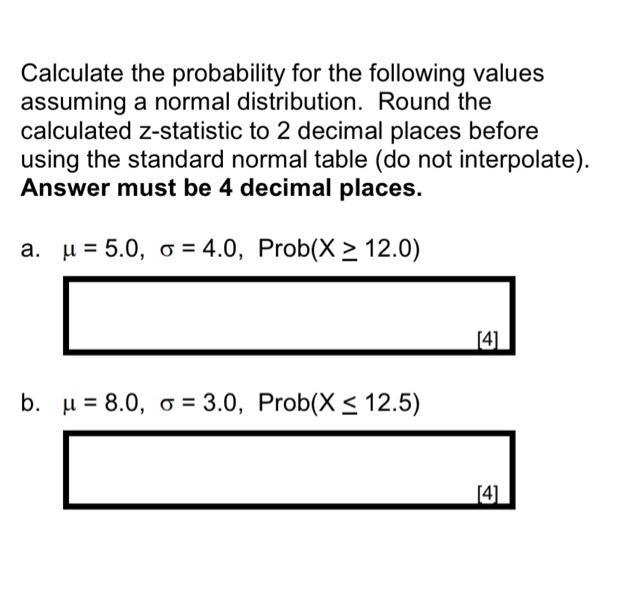
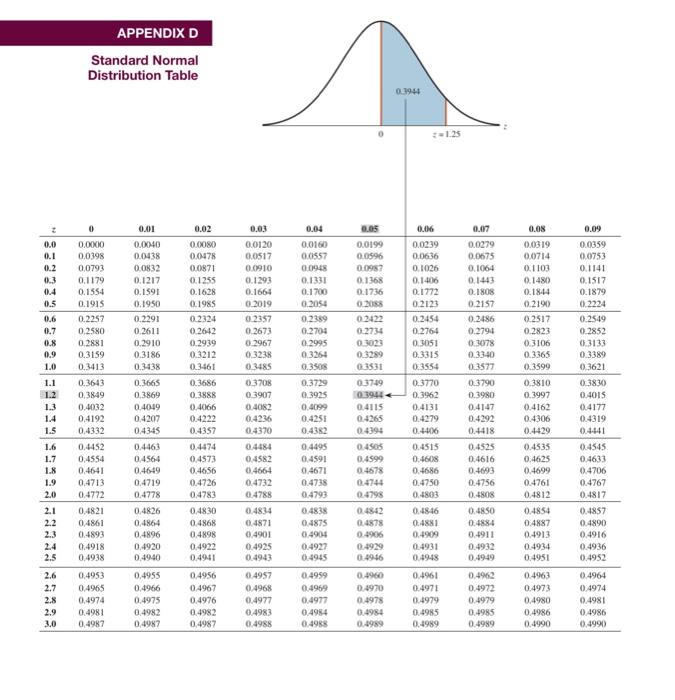
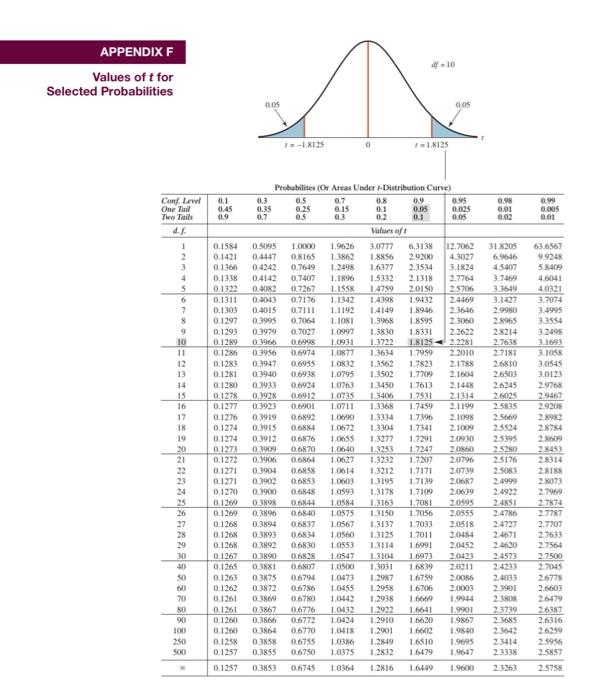
Calculate the probability for the following values assuming a normal distribution. Round the calculated z-statistic to 2 decimal places before using the standard normal table (do not interpolate). Answer must be 4 decimal places. a. = 5.0, o = 4.0, Prob(X2 12.0) b. = 8.0, o = 3.0, Prob(X 12.5) [4] 4 0.0 0.1 0.2 0.3 0.4 0.5 0.6 0.7 1.1 1.2 APPENDIX D Standard Normal Distribution Table 0 0.0000 0,0398 0.0793 0.1179 0.8 0.2881 0,9 0.3159 1.0 0.3413 0.1554 0.1915 2.2 2.3 0.2257 0,2580 1.3 0,4032 1.4 0.4192 1.5 0,4332 2.6 2.7 2.8 2.9 3.0 0.3643 0.3849 1.6 0.4452 1.7 0.4554 0.4641 1.8 1.9 0.4713 2.0 0.4772 2.1 0,4821 0,4861 0.4893 2.4 0.4918 2.5 0,4938 0,4953 0,4965 0,4974 0.4981 0,4987 0.01 0.0040 0.0438 0.0832 0.1217 0.1591 0.1950 0.2291 0.2611 0,2910 0.3186 0.3438 0.3665 0.3869 0.4049 0.4207 0.4345 0.4463 0.4564 04649 0.4719 0.4778 0.4826 0.4864 0.4896 0,4920 0,4940 0,4955 0.4966 0.4975 0.4982 0,4987 0.02 0.0080 0.0478 0.0871 0.1255 0.1628 0.1985 0.2324 0.2642 0.2939 0.3212 0.3461 0.3686 0.3888 0.4066 0.4222 0.4357 0.4474 0,4573 0.4656 0.4726 0.4783 0,4830 0.4868 0.4898 0,4922 0.4941 0.4956 0.4967 0.4976 0,4982 0,4987 0.03 0.0120 0.0517 0.0910 0.1293 0.1664 0.2019 0.2357 0.2673 0.2967 0.3238 0.3485 0.3708 0.3907 0.4082 0.4236 0.4370 0.4484 0,4582 04664 0.4732 0.4788 0.4834 0.4871 0,4901 0.4925 0.4943 0.4957 0.4968 0.4977 0.4983 0.4988 0.04 0.0160 0.0557 0.0948 0.1331 0.1700 0.2054 0,2389 0.2704 0.2995 0.3264 0.3508 0.3729 0.3925 0.4099 0.4251 0.4382 0.4495 0.4591 0.4671 0.4738 0.4793 0.4838 0.4875 0,4904 0.4927 0.4945 0.4959 0.4969 0.4977 0,4984 0.4988 0.05 0.0199 0.0596 0.0987 0.1368 0.1736 0.2088 0.2422 0.2734 0.3023 0.3289 03531 03749 0.3944 0.4115 0.4265 0.4394 0.4505 0,4599 0.4678 0.4744 0.4798 0.4842 0.4878 0.4906 0.4929 0.4946 0.4960 0.4970 0.4978 0.4984 0.4989 0.3944 z = 1.25 0.06 0.0239 0.0636 0.1026 0.1406 0.1772 0.2123 0.2454 0.2764 0.3051 0.3315 0:3554 0.3770 0.3962 0.4131 0.4279 0.4406 0.4515 0.4608 0.4686 0.4750 0.4803 0.4846 0.4881 0.4909 0.4931 0.4948 0,4961 0.4971 0.4979 0.4985 0.4989 0.07 0.0279 0.0675 0.1064 0.1443 0.1808 0.2157 0.2486 0.2794 0.3078 0.3340 0.3577 0.3790 0.3980 0.4147 0.4292 0.4418 0.4525 0.4616 0.4693 0.4756 0.4808 0.4850 0.4884 0.4911 0.4932 0.4949 0.4962 0.4972 0.4979 0.4985 0.4989 0.08 0.0319 0.0714 0.1103 0.1480 0.1844 0.2190 0.2517 0.2823 0.3106 0.3365 0.3599 0.3810 0.3997 0.4162 0.4306 0.4429 0.4535 0.4625 0.4699 0.4761 0.4812 0.4854 0.4887 0.4913 0.4934 0.4951 0.4963 0.4973 0.4980 0.4986 0.4990 0.09 0.0359 0.0753 0.1141 0.1517 0.1879 0.2224 0.2549 0.2852 0.3133 0.3389 0.3621 0.3830 0.4015 0.4177 0.4319 0.4441 0.4545 0.4633 0.4706 0.4767 0.4817 0.4857 0.4890 0.4916 0.4936 0.4952 0.4964 0.4974 0.4981 0.4986 0,4990 APPENDIX F Values of t for Selected Probabilities Conf. Level One Tail Two Tails 4.f 1 2 3 4 5 6 7 8 9 10 11 12 13 14 15 16 17 18 19 20 21 22 23 24 25 26 27 28 29 30 40 50 60 70 80 90 100 250 500 00 0.1 0.45 0.9 0.05 0.3 0.35 0.7 1=-1.8125 0.5 0.25 0.5 Probabilites (Or Areas Under 1-Distribution Curve) 0.7 0.15 0.3 0.8 0.1 0,2 Values of t 4-10 71.8125 0.9 0.05 0.1 0.05 0.95 0.025 0.05 0.98 0.01 0.02 12.7062 31.8205 0.1584 0.5095 1.0000 1.9626 0.1421 0.4447 0.8165 1.3862 1.2498 0.1366 0.4242 0.7649 3.1427 2.9980 2,3060 2.8965 2.8214 2.7638 2.7181 2.6810 2.6503 0.1277 0.3923 0.6901 3.0777 6.3138 1.8856 2.92000 4.3027 6.9646 1.6377 2.3534 3.1824 4.5407 0.1338 0.4142 0.7407 1.1896 1.5332 2.1318 2.7764 3.7469 0.1322 0.4082 0.7267 1.1558 1.4759 20150 2.5706 3.3649 0.1311 0.4043 0.7176 1.1342 1.4398 1.9432 2.4469 0.1303 0.4015 0.7111 1.1192 1.4149 1.8946 2.3646 0.1297 0.3995 0.7064 1.1081 1.3968 1.8595 0.1293 0.3979 0.7027 1.0997 1.3830 1.8331 2.2622 0.1289 0.3966 0.6998 1.0931 1.3722 1.8125- 2.2281 0.1286 0.3956 0.6974 1.0877 1.3634 1.7959 2.2010 0.1283 0.3947 0.6955 1.0832 1.3562 1.7823 2.1788 0.1281 0.3940 0.6938 1.0795 1.3502 1.7709 2.1604 0.1280 0.3933 0.6924 1.0763 1.3450 1.7613 2.1448 2.6245 0.1278 0.3928 0.6912 1.0735 1.3406 1.7531 2.1314 2.6025 1.0711 1.3368 1.7459 2.1199 2.5835 0.1276 0.3919 0.6892 1.0690 1.3334 1.7396 2.1098 2.5669 0.1274 0.3915 0.6884 1.0672 1.3304 1.7341 2.1009 2.5524 0.1274 0.3912 0.6876 1.0655 1.3277 1.7291 2,0930 2.5395 0.1273 0.3909 0.6870 1.0640 1.3253 1.7247 2.0860 25280 0.1272 0.3906 0.6864 1.0627 1.3232 1.7207 2.0796 2.5176 0.1271 0.3904 0.6858 1.0614 1.3212 1.7171 2.0739 2.5083 0.1271 0.3902 0.6853 1.0603 1.3195 1.7139 2.0687 0.1270 0.3900 0.6848 1.0593 1.3178 1.7109 0.1269 0.3898 0.6844 1.0584 1.3163 1.7081 0.1269 0.3896 0.6840 1.0575 1.3150 1.7056 0.1268 0.3894 0.6837 1.0567 1.3137 1.7033 0.1268 0.3893 0.6834 1.0560 1.3125 1.7011 0.1268 0.3892 0.6830 1.0553 1.3114 1.6991 0.1267 0.3890 0.6828 1.0547 1.3104 1.6973 0.1265 0.3881 0.6807 1.0500 1.3031 1.6839 20211 24233 0.1263 0.3875 0.6794 1.0473 1.2987 1.6759 20086 0.1262 0.3872 0.6786 1.0455 1.2958 1.6706 2.0003 0.1261 0.3869 0.6780 1.0442 1.2938 1.6669 1.9944 0.1261 0.3867 0.6776 1.0432 1.2922 1.6641 1.9901 0.1260 0.3866 0.6772 1.0424 1.2910 1.6620 0,1260 0.3864 0.6770 1.2901 1.6602 1.9840 2.3642 0.1258 0.3858 0.6755 1.0386 1.2849 1.6510 1.9695 0.1257 0.3855 0.6750 1.0375 1.2832 1.6479 1.9647 10364 1.2816 1.6449 1.9600 2.4999 2.0639 2.4922 2.0595 2.4851 2.0555 24786 2.0518 2.4727 20484 2.4671 20452 24620 2.0423 2.4573 2.4033 2.3901 2.3808 2.3739 1.9867 2.3685 1.0418 2.3414 2.3338 0.1257 0.3853 0.6745 0.99 0.005 0.01 63.6567 9.9248 5.8409 4.6041 4.0321 3.7074 3.4995 3.3554 3.2498 3.1693 3.1058 3.0545 3.0123 29768 29467 2.9208 2.8982 2.8784 2.8609 28453 2.8314 28188 2.8073 2.7969 2.7874 2.7787 2.7707 2.7633 2.7564 2.7500 2.7045 26778 2.6603 26479 26387 26316 26259 2.5956 2.5857 2.5758
Step by Step Solution
3.44 Rating (163 Votes )
There are 3 Steps involved in it
To calculate the probabilities using the standard normal distribution we need to standardize the val... View full answer

Get step-by-step solutions from verified subject matter experts