

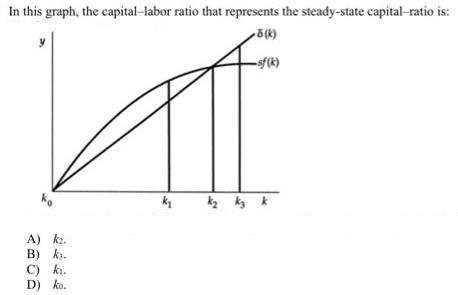
Question: In this graph, the capital-labor ratio that represents the steady-state capital-ratio is: 5(k) -sf(k) Ko A) k2. B) ks. C) ki. D) ko. k
In this graph, the capital-labor ratio that represents the steady-state capital-ratio is: 5(k) -sf(k) Ko A) k2. B) ks. C) ki. D) ko. k k2ky k 25 J
Step by Step Solution
★★★★★
3.61 Rating (158 Votes )
There are 3 Steps involved in it
1 Expert Approved Answer
Step: 1 Unlock

Option a is correct K2 Explanation steady state depreciation investment when capitalla... View full answer
Question Has Been Solved by an Expert!
Get step-by-step solutions from verified subject matter experts
Step: 2 Unlock
Step: 3 Unlock