

Question: Calculate the remaining content based on the information in the first picture First Year Assignment Assumptions Hist. Prof. Proj. Proj. Proj. Proj Year Year 1
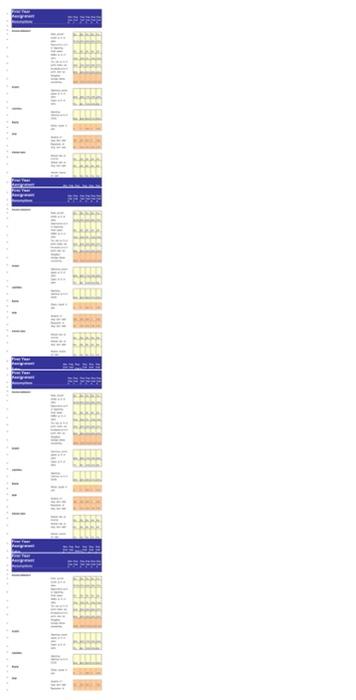
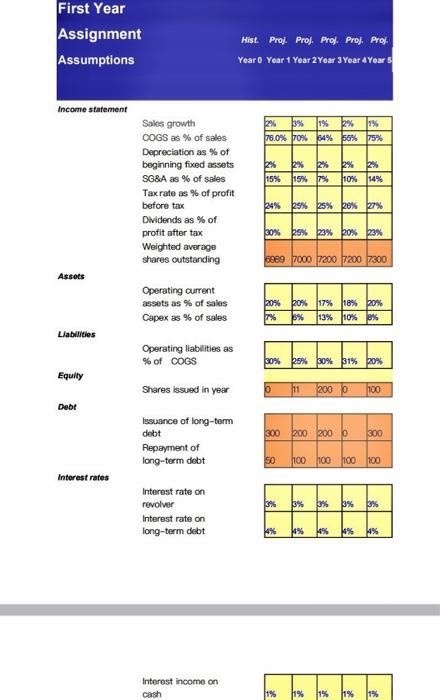
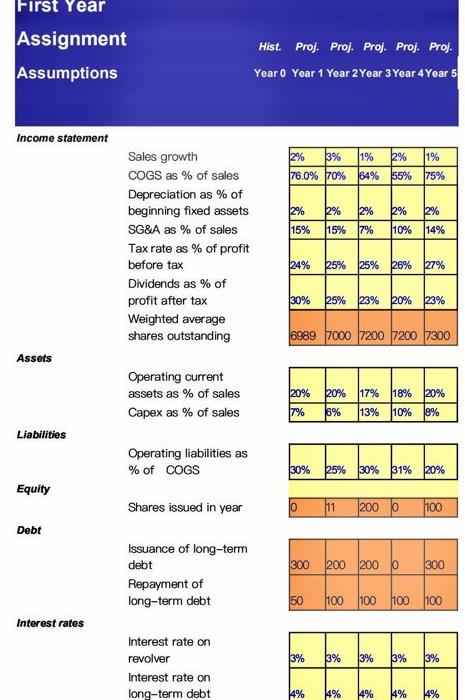
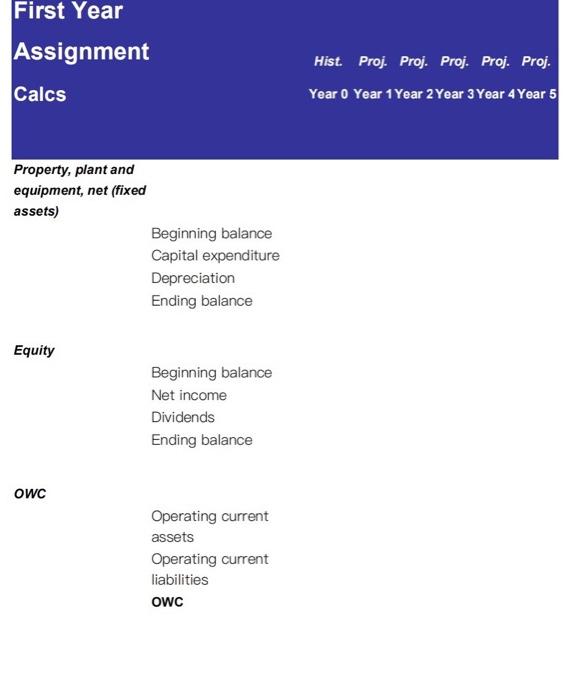
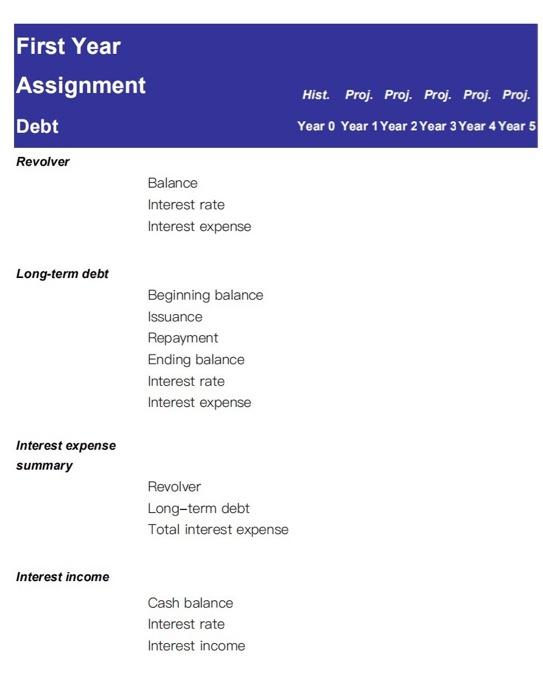
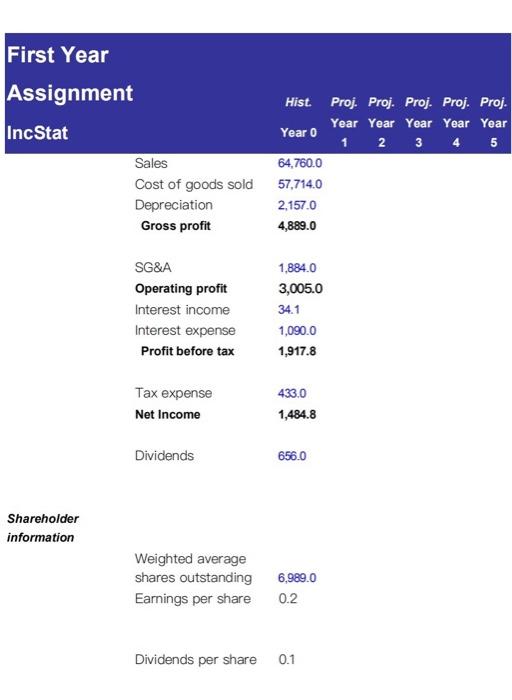
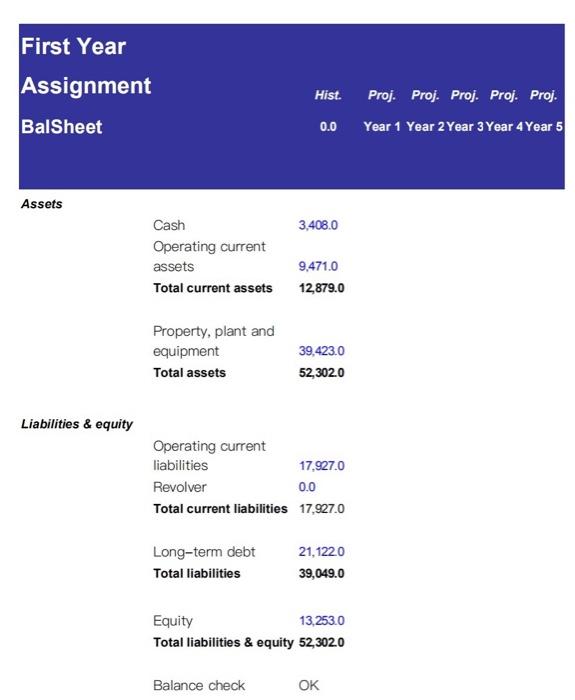
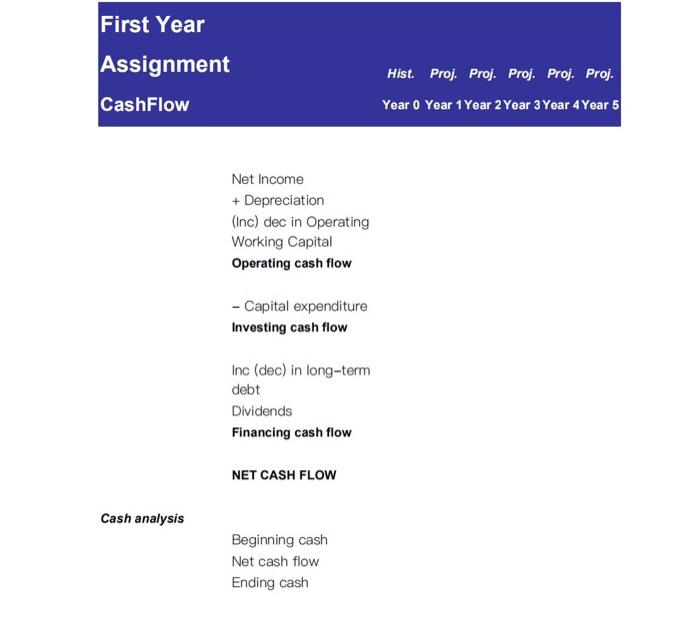
First Year Assignment Assumptions Hist. Prof. Proj. Proj. Proj. Proj Year Year 1 Year 2 Yoar 3 Year 4 Years Income statement 3% 1% 2% 78.0% 70% 54% 55% 75% 12% 2% 15% 2% 15% 10% 14% Sales growth COGS as % of sales Depreciation as % of beginning fixed assets SG&A as % of sales Tax rate as % of profit before tax Dividends as % of profit after tax Weighted average shares outstanding 24% 25% 25% 20% 27% 30% 55% 23% 20% 23% 1989 7000 7200 7200 7300 Assets Operating current assets as % of sales Capex as % of sales % 13% 10% % Liabilities 30% 25% 30% 31% 20% Equity Operating liabilities as % of COGS Shares issued in year 11 2006 100 Debt 300 200 200 300 Issuance of long-term debt Repayment of long-term debt 50 100 100 100 100 Interest rates 33% 13% % % 3% Interest rate on revolver Interest rate on long-term debt 14% 14% 14% 14% 14% Interest income on cash 1% First Year Assignment Assumptions Hist. Proj. Proj. Proj. Proj. Proj. Year o Year 1 Year 2 Year 3 Year 4 Year 5 Income statement 3% 1% 2% 1% 2% 76.0% 70% 64% 55% 75% 12% 12% 2% 12% 2% 15% 15% 17% 10% 14% Sales growth COGS as % of sales Depreciation as % of beginning fixed assets SG&A as % of sales Tax rate as % of profit before tax Dividends as % of profit after tax Weighted average shares outstanding 24% 25% 25% 26% 27% 30% 25% 23% 20% 23% 6989 7000 7200 7200 7300 Assets Operating current assets as % of sales Capex as % of sales 20% 20% 17% 18% 20% 8% 7% 6% 13% 10% Liabilities Operating liabilities as % of COGS 30% 25% 30% 31% 20% Equity Shares issued in year 111 200 100 Debt 300 200 200 to 300 Issuance of long-term debt Repayment of long-term debt 50 100 100 100 100 Interest rates 3% 3% 3% 3% 3% Interest rate on revolver Interest rate on long-term debt 14% 14% 4% 4% 4% First Year Assignment Hist. Proj. Proj. Proj. Proj. Proj. Calcs Year 0 Year 1 Year 2 Year 3 Year 4 Year 5 Property, plant and equipment, net (fixed assets) Beginning balance Capital expenditure Depreciation Ending balance Equity Beginning balance Net income Dividends Ending balance OWC Operating current assets Operating current liabilities OWC First Year Assignment Hist. Proj. Proj. Proj. Proj. Proj. Debt Year 0 Year 1 Year 2 Year 3 Year 4 Year 5 Revolver Balance Interest rate Interest expense Long-term debt Beginning balance Issuance Repayment Ending balance Interest rate Interest expense Interest expense summary Revolver Long-term debt Total interest expense Interest income Cash balance Interest rate Interest income First Year Assignment Hist. Inc Stat Year Proj. Proj. Proj. Proj. Proj. Year Year Year Year Year 1 2 3 5 Sales Cost of goods sold Depreciation Gross profit 64,760.0 57,714.0 2.157.0 4,889.0 SG&A Operating profit Interest income Interest expense Profit before tax 1,884.0 3,005.0 34.1 1,090.0 1,917.8 Tax expense Net Income 433.0 1,484.8 Dividends 656.0 Shareholder information Weighted average shares outstanding Earnings per share 6,989.0 0.2 Dividends per share 0.1 First Year Assignment Hist. Proj. Proj. Proj. Proj. Proj. Year 1 Year 2 Year 3 Year 4 Year 5 BalSheet 0.0 Assets 3,408.0 Cash Operating current assets Total current assets 9.471.0 12,879.0 Property, plant and equipment Total assets 39,423.0 52,302.0 Liabilities & equity Operating current liabilities 17.927.0 Revolver 0.0 Total current liabilities 17.927.0 Long-term debt Total liabilities 21,1220 39,049.0 Equity 13,253.0 Total liabilities & equity 52,3020 Balance check OK First Year Assignment Hist. Proj. Proj. Proj. Proj. Proj. Year 0 Year 1 Year 2 Year 3 Year 4 Year 5 CashFlow Net Income + Depreciation (Inc) dec in Operating Working Capital Operating cash flow - Capital expenditure Investing cash flow Inc (dec) in long-term debt Dividends Financing cash flow NET CASH FLOW Cash analysis Beginning cash Net cash flow Ending cash First Year Assignment Assumptions Hist. Prof. Proj. Proj. Proj. Proj Year Year 1 Year 2 Yoar 3 Year 4 Years Income statement 3% 1% 2% 78.0% 70% 54% 55% 75% 12% 2% 15% 2% 15% 10% 14% Sales growth COGS as % of sales Depreciation as % of beginning fixed assets SG&A as % of sales Tax rate as % of profit before tax Dividends as % of profit after tax Weighted average shares outstanding 24% 25% 25% 20% 27% 30% 55% 23% 20% 23% 1989 7000 7200 7200 7300 Assets Operating current assets as % of sales Capex as % of sales % 13% 10% % Liabilities 30% 25% 30% 31% 20% Equity Operating liabilities as % of COGS Shares issued in year 11 2006 100 Debt 300 200 200 300 Issuance of long-term debt Repayment of long-term debt 50 100 100 100 100 Interest rates 33% 13% % % 3% Interest rate on revolver Interest rate on long-term debt 14% 14% 14% 14% 14% Interest income on cash 1% First Year Assignment Assumptions Hist. Proj. Proj. Proj. Proj. Proj. Year o Year 1 Year 2 Year 3 Year 4 Year 5 Income statement 3% 1% 2% 1% 2% 76.0% 70% 64% 55% 75% 12% 12% 2% 12% 2% 15% 15% 17% 10% 14% Sales growth COGS as % of sales Depreciation as % of beginning fixed assets SG&A as % of sales Tax rate as % of profit before tax Dividends as % of profit after tax Weighted average shares outstanding 24% 25% 25% 26% 27% 30% 25% 23% 20% 23% 6989 7000 7200 7200 7300 Assets Operating current assets as % of sales Capex as % of sales 20% 20% 17% 18% 20% 8% 7% 6% 13% 10% Liabilities Operating liabilities as % of COGS 30% 25% 30% 31% 20% Equity Shares issued in year 111 200 100 Debt 300 200 200 to 300 Issuance of long-term debt Repayment of long-term debt 50 100 100 100 100 Interest rates 3% 3% 3% 3% 3% Interest rate on revolver Interest rate on long-term debt 14% 14% 4% 4% 4% First Year Assignment Hist. Proj. Proj. Proj. Proj. Proj. Calcs Year 0 Year 1 Year 2 Year 3 Year 4 Year 5 Property, plant and equipment, net (fixed assets) Beginning balance Capital expenditure Depreciation Ending balance Equity Beginning balance Net income Dividends Ending balance OWC Operating current assets Operating current liabilities OWC First Year Assignment Hist. Proj. Proj. Proj. Proj. Proj. Debt Year 0 Year 1 Year 2 Year 3 Year 4 Year 5 Revolver Balance Interest rate Interest expense Long-term debt Beginning balance Issuance Repayment Ending balance Interest rate Interest expense Interest expense summary Revolver Long-term debt Total interest expense Interest income Cash balance Interest rate Interest income First Year Assignment Hist. Inc Stat Year Proj. Proj. Proj. Proj. Proj. Year Year Year Year Year 1 2 3 5 Sales Cost of goods sold Depreciation Gross profit 64,760.0 57,714.0 2.157.0 4,889.0 SG&A Operating profit Interest income Interest expense Profit before tax 1,884.0 3,005.0 34.1 1,090.0 1,917.8 Tax expense Net Income 433.0 1,484.8 Dividends 656.0 Shareholder information Weighted average shares outstanding Earnings per share 6,989.0 0.2 Dividends per share 0.1 First Year Assignment Hist. Proj. Proj. Proj. Proj. Proj. Year 1 Year 2 Year 3 Year 4 Year 5 BalSheet 0.0 Assets 3,408.0 Cash Operating current assets Total current assets 9.471.0 12,879.0 Property, plant and equipment Total assets 39,423.0 52,302.0 Liabilities & equity Operating current liabilities 17.927.0 Revolver 0.0 Total current liabilities 17.927.0 Long-term debt Total liabilities 21,1220 39,049.0 Equity 13,253.0 Total liabilities & equity 52,3020 Balance check OK First Year Assignment Hist. Proj. Proj. Proj. Proj. Proj. Year 0 Year 1 Year 2 Year 3 Year 4 Year 5 CashFlow Net Income + Depreciation (Inc) dec in Operating Working Capital Operating cash flow - Capital expenditure Investing cash flow Inc (dec) in long-term debt Dividends Financing cash flow NET CASH FLOW Cash analysis Beginning cash Net cash flow Ending cash
Step by Step Solution
There are 3 Steps involved in it

Get step-by-step solutions from verified subject matter experts