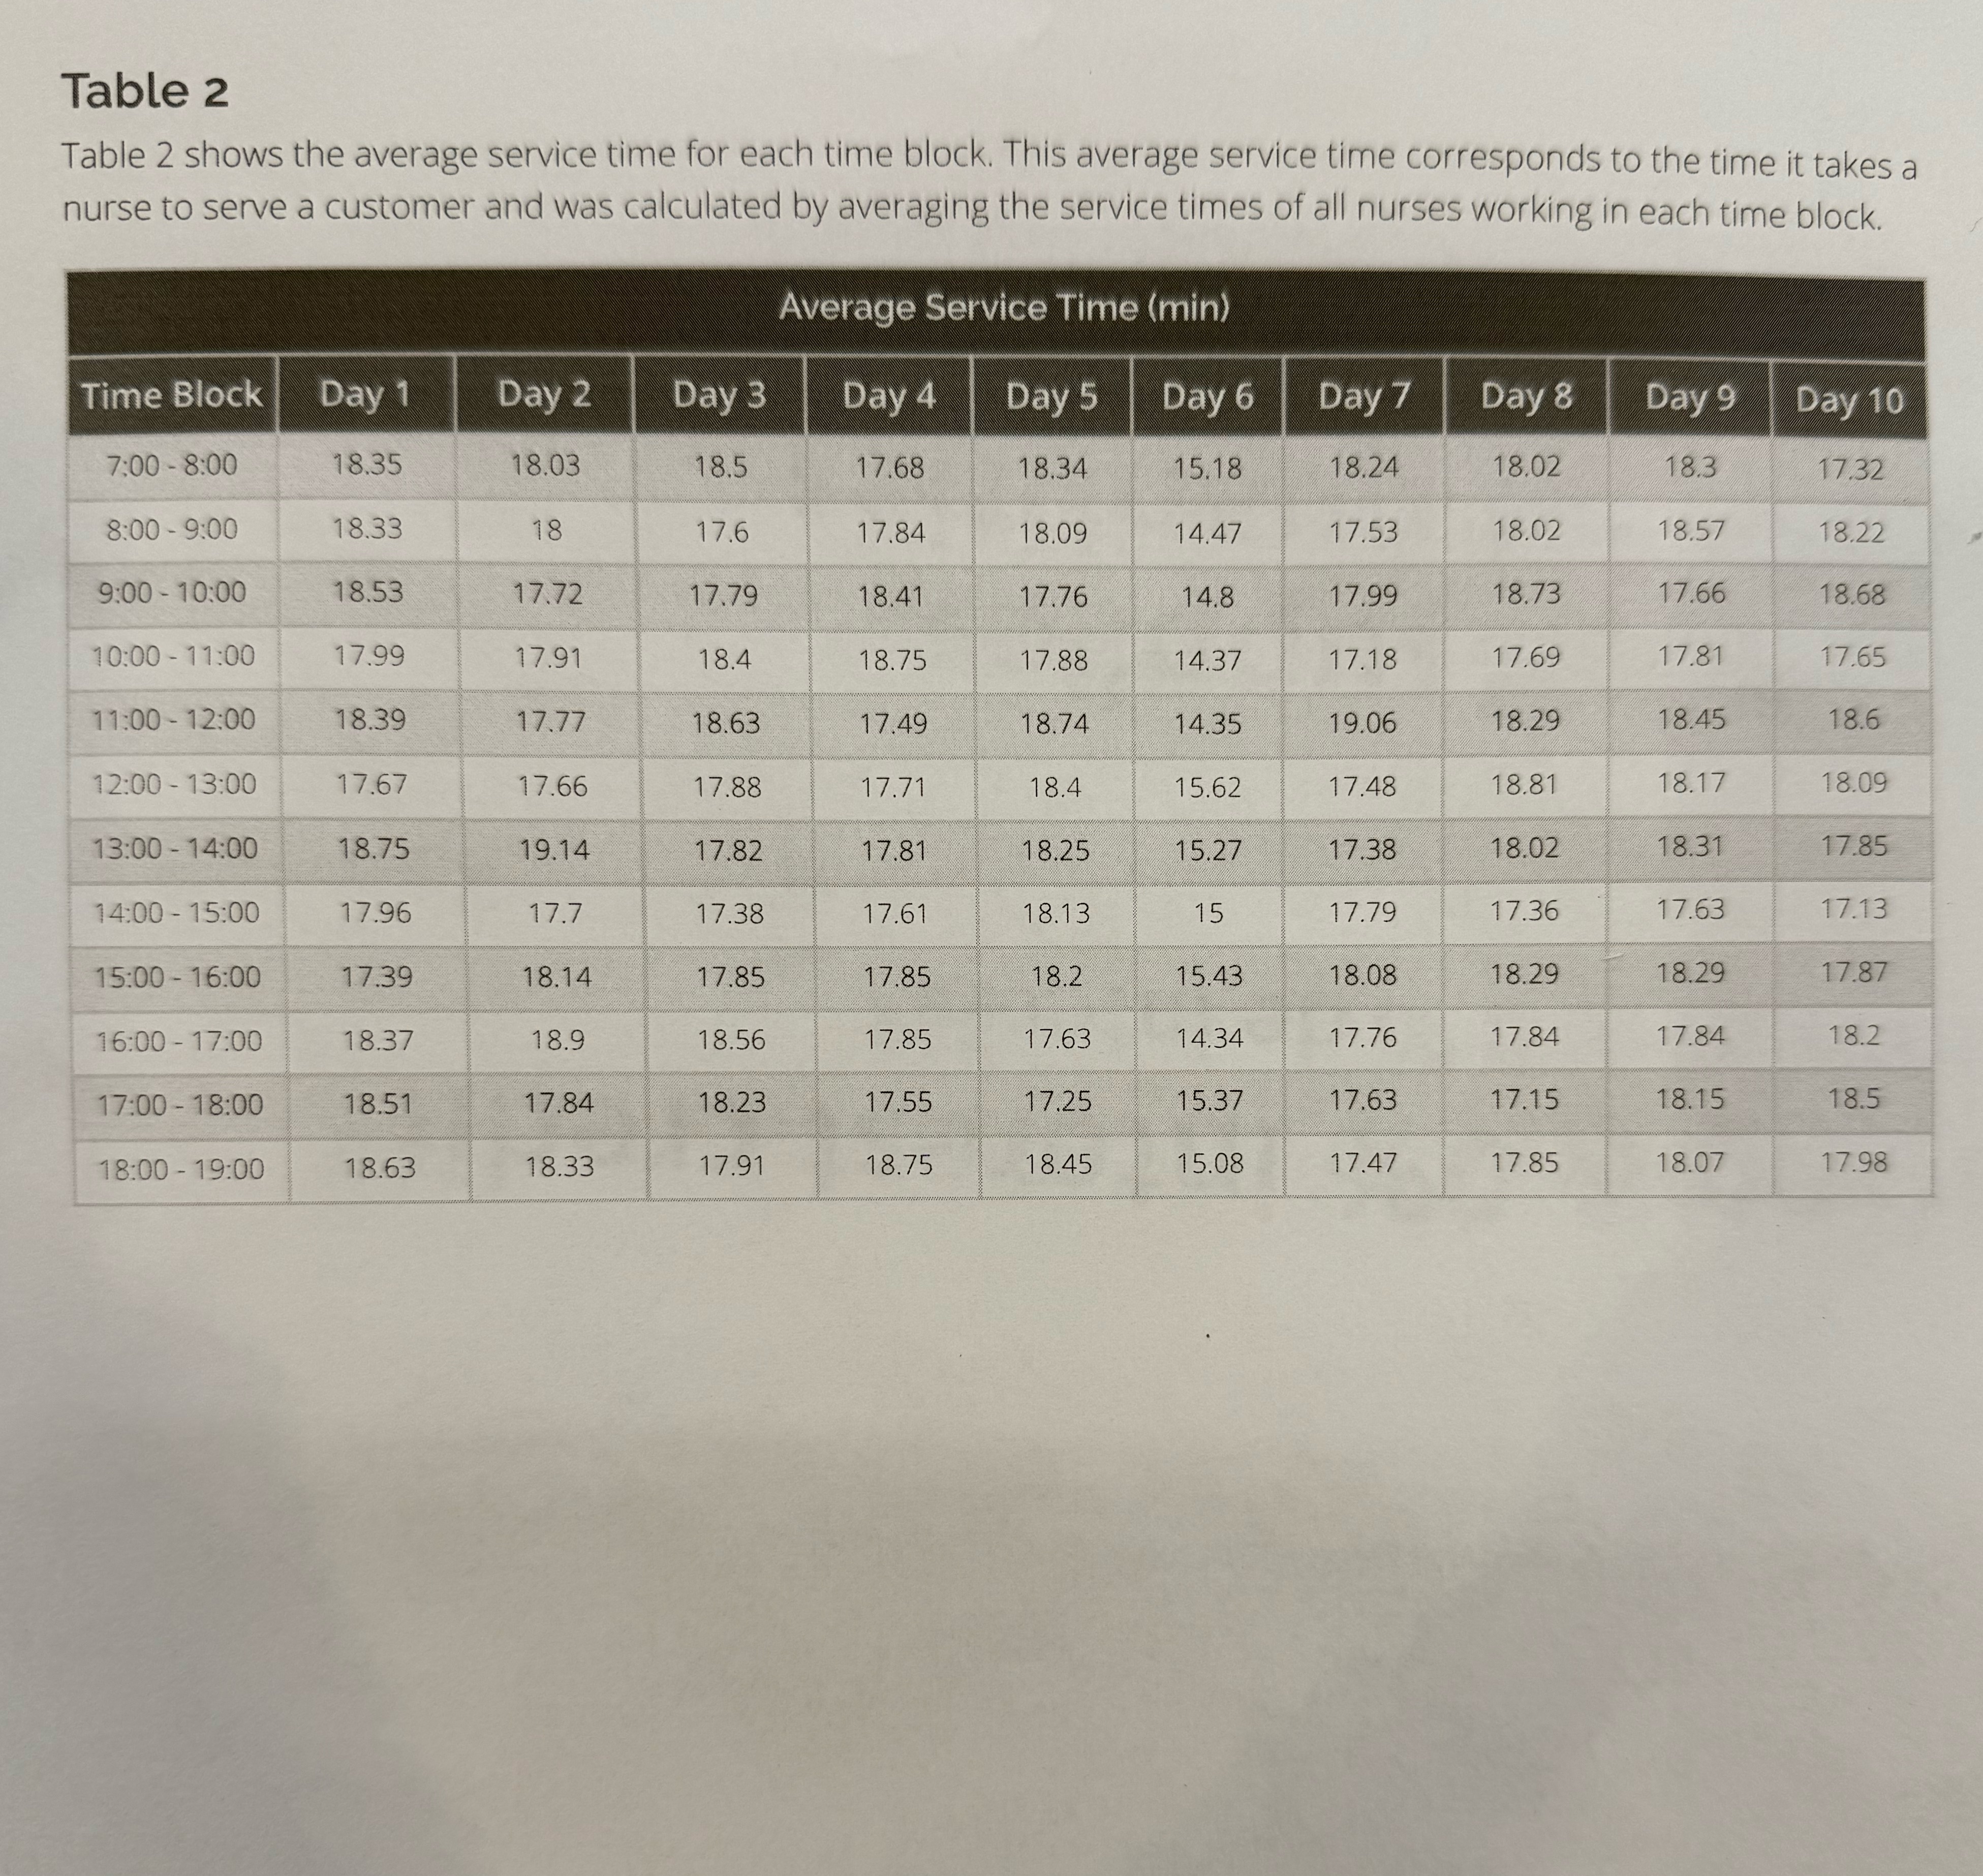
Question: Calculate the standard deviation for the service time . Use the data points in the time blocks that correspond to the peak hours. Provide the

Calculate the standard deviation for the service time . Use the data points in the time blocks that correspond to the peak hours. Provide the value in the space below

Calculate the standard deviation for the service
Table 2 Table 2 shows the average service time for each time block. This average service time corresponds to the time it takes a nurse to serve a customer and was calculated by averaging the service times of all nurses working in each time block. Average Service Time (min) Time Block Day 1 Day 2 Day 3 Day 4 Day 5 Day 6 Day 7 Day 8 Day 9 Day 10 7:00 - 8:00 18.35 18.03 18.5 17.68 18.34 15.18 18.24 18.02 183 17.32 8:00 - 9:00 18.33 18 17.6 17.84 18.09 14.47 17.53 18.02 18.57 18.22 9:00 - 10:00 18.53 17.72 17.79 8.41 17.76 14.8 17.99 18.73 17.66 18.68 10:00 - 11:00 17.99 17.91 18.4 18.75 17.88 14.37 17.18 17.69 17.81 17.65 11:00 - 12:00 18.39 17.77 18.63 17.49 18.74 14.35 19.06 18.29 18.45 18.6 12:00 - 13:00 17.67 17.66 17.88 17.71 18.4 15.62 17.48 18.81 18.17 18.09 17.85 13:00 - 14:00 18.75 19.14 17.82 17.81 18.25 15.27 17.38 18.02 18.3 14:00 - 15:00 17.96 17. 17.38 17.61 18.13 15 17.79 17.36 17.63 17.13 17.85 8.2 15.43 18.08 18.29 18.29 17.87 15:00 - 16:00 17.39 18.14 17.85 16:00 -17:00 18.37 18.9 18.56 17.85 17.63 14.34 17.76 17.84 17.84 18.2 17:00- 18:00 18.5 17.84 18.23 17.55 17.25 15.37 17.63 17.15 18.15 18.5 18.63 18.33 17.91 18.75 18.45 15.08 17.47 17.85 18.07 17.98 18:00 - 19:00

Step by Step Solution

There are 3 Steps involved in it

1 Expert Approved Answer
Step: 1 Unlock blur-text-image
Question Has Been Solved by an Expert!

Get step-by-step solutions from verified subject matter experts

Step: 2 Unlock
Step: 3 Unlock

Students Have Also Explored These Related Accounting Questions!