

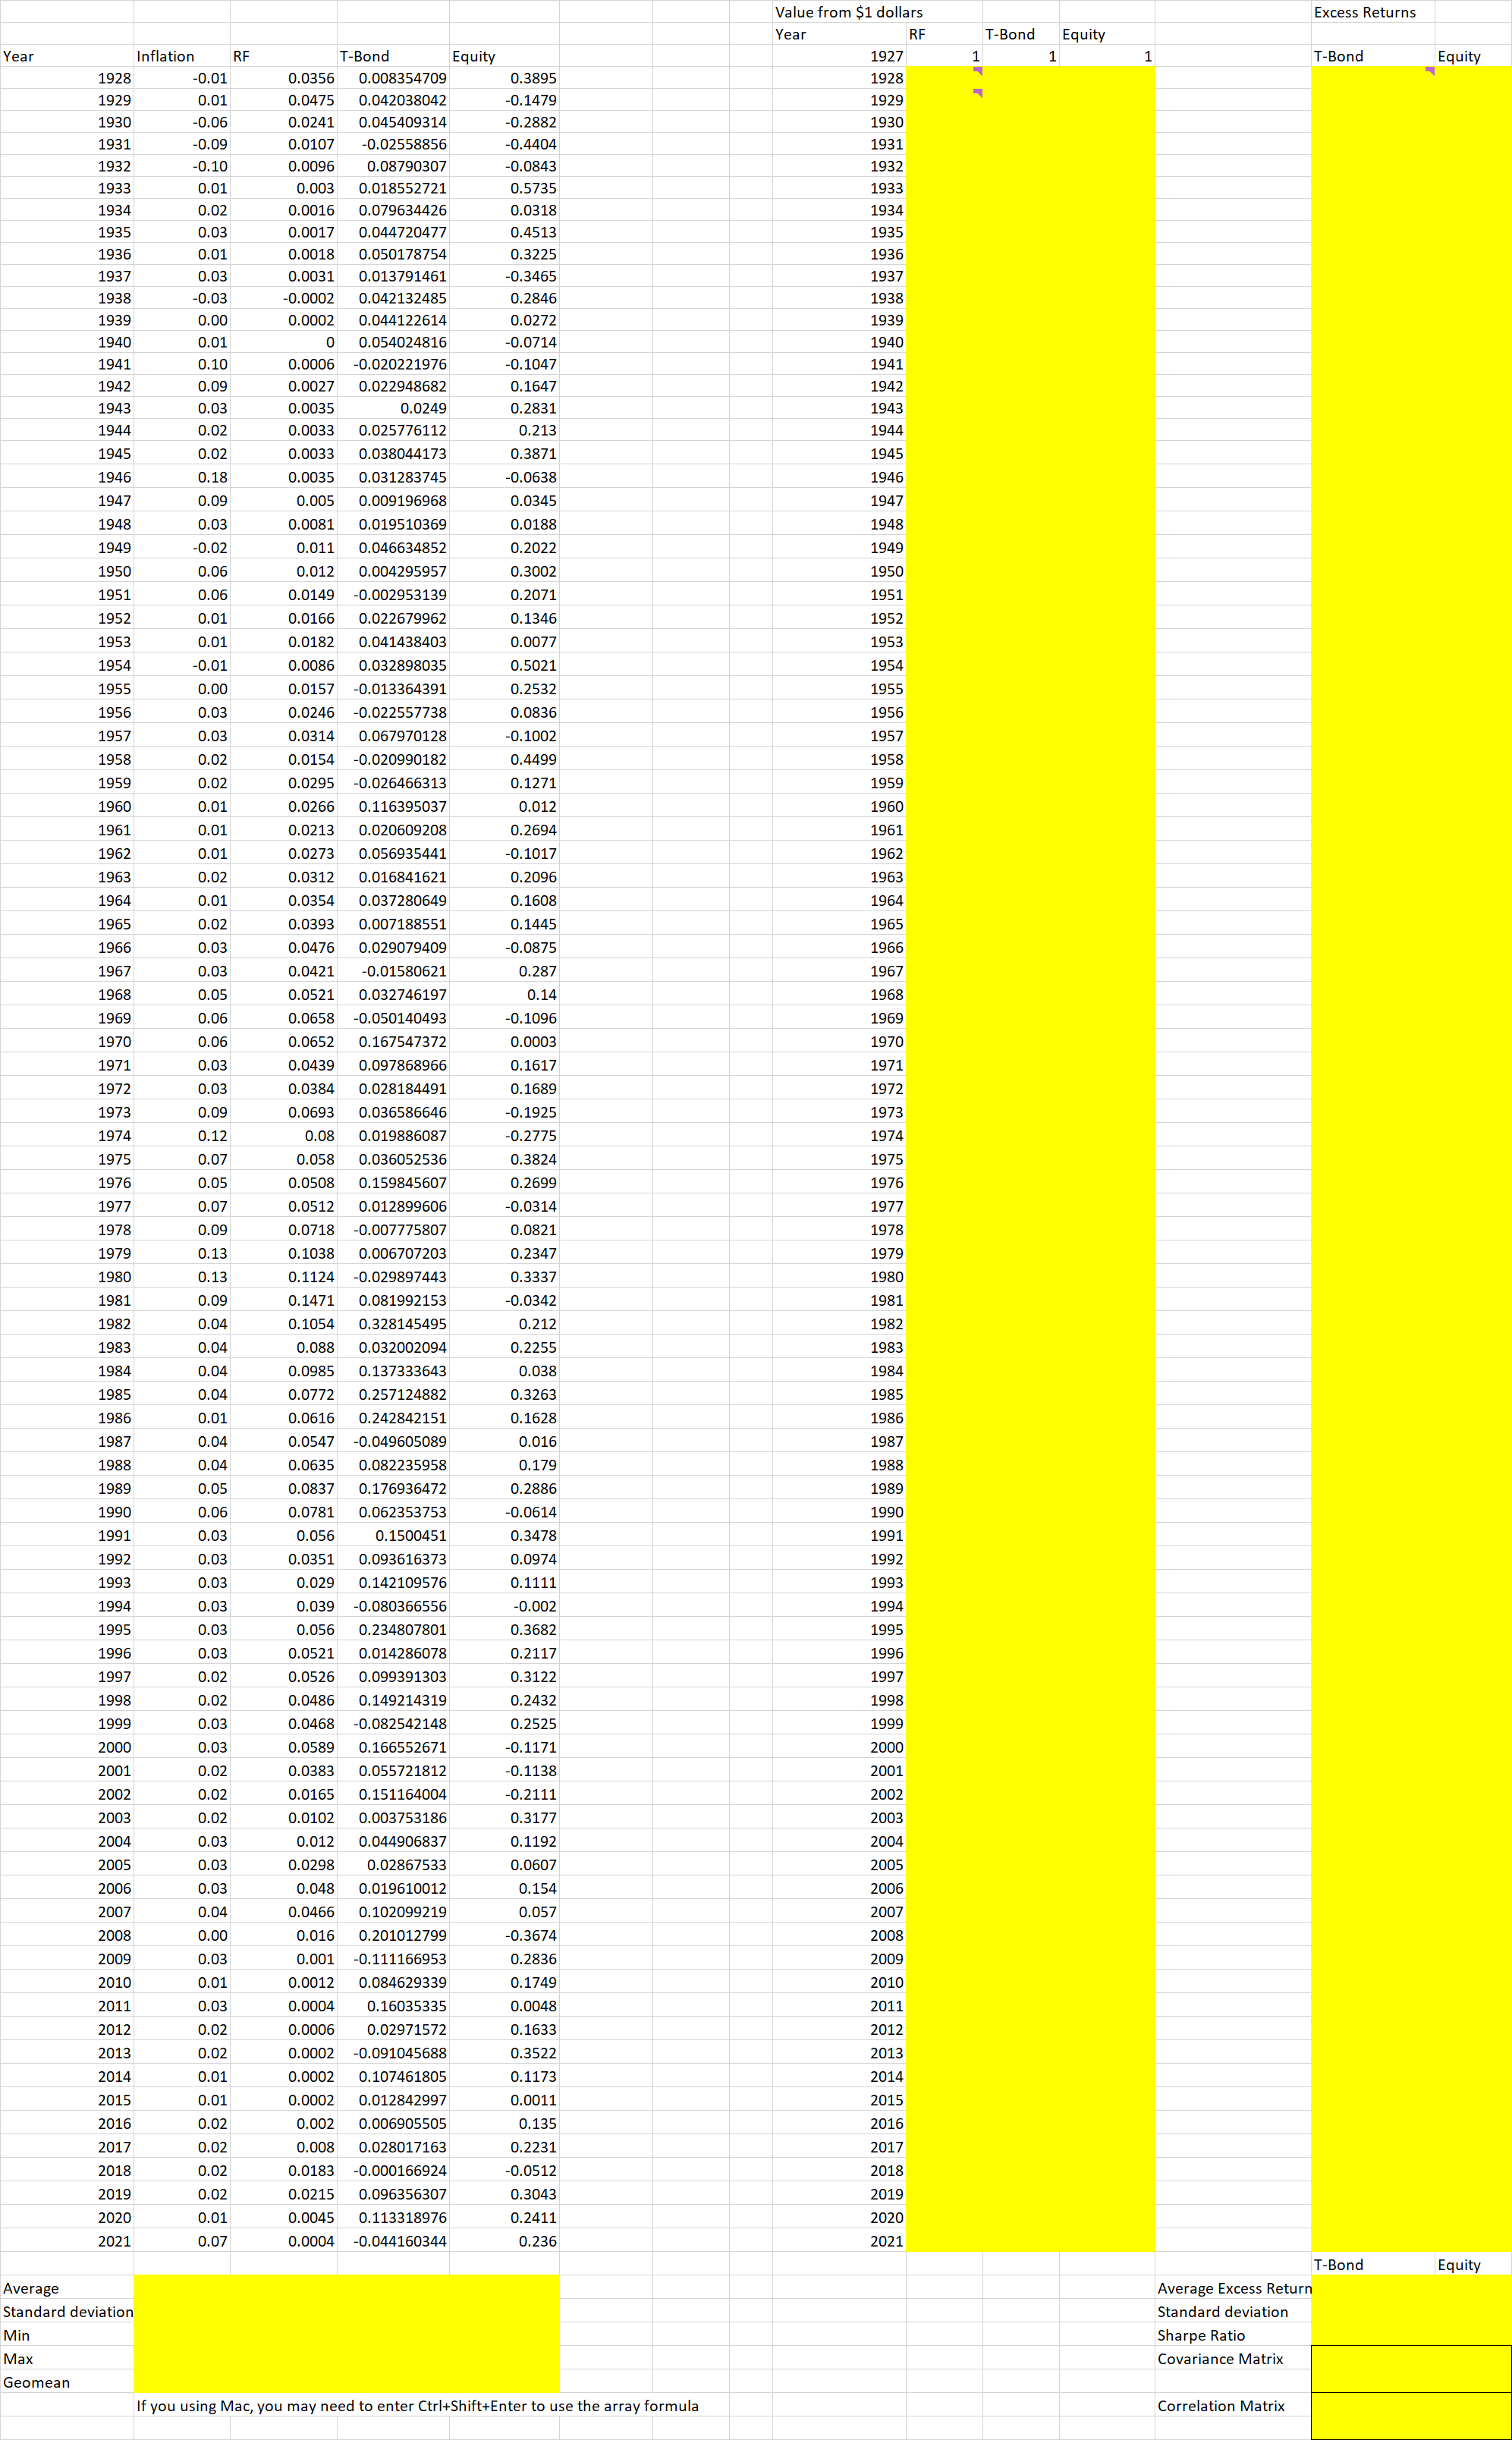
Question: Calculate the summary statistics: Arithmetic average, standard deviation, Min, Max, and geometric average. Calculate the end - of - year values for each asset class
Calculate the summary statistics: Arithmetic average, standard deviation, Min, Max, and geometric average.
Calculate the endofyear values for each asset class RF TBond and Equity with $ investment at the end of And plot them in a Chart. Make sure that you use the log scale on the yaxis.
Calculate annual excess returns time series for Tbond and Equity. Present the average excess returns, standard deviations, and Sharpe ratio.
Present the covariance and correlation matrix of the excess returns of Tbond and Equity.
Step by Step Solution
There are 3 Steps involved in it
1 Expert Approved Answer
Step: 1 Unlock

Question Has Been Solved by an Expert!
Get step-by-step solutions from verified subject matter experts
Step: 2 Unlock
Step: 3 Unlock