

Question: Calculate the test statisticX2o= Round to the nearest third decimalThe P value is?Round to the nearest third decimal. The following data represent the level of
Calculate the test statisticX2o= Round to the nearest third decimalThe P value is?Round to the nearest third decimal.
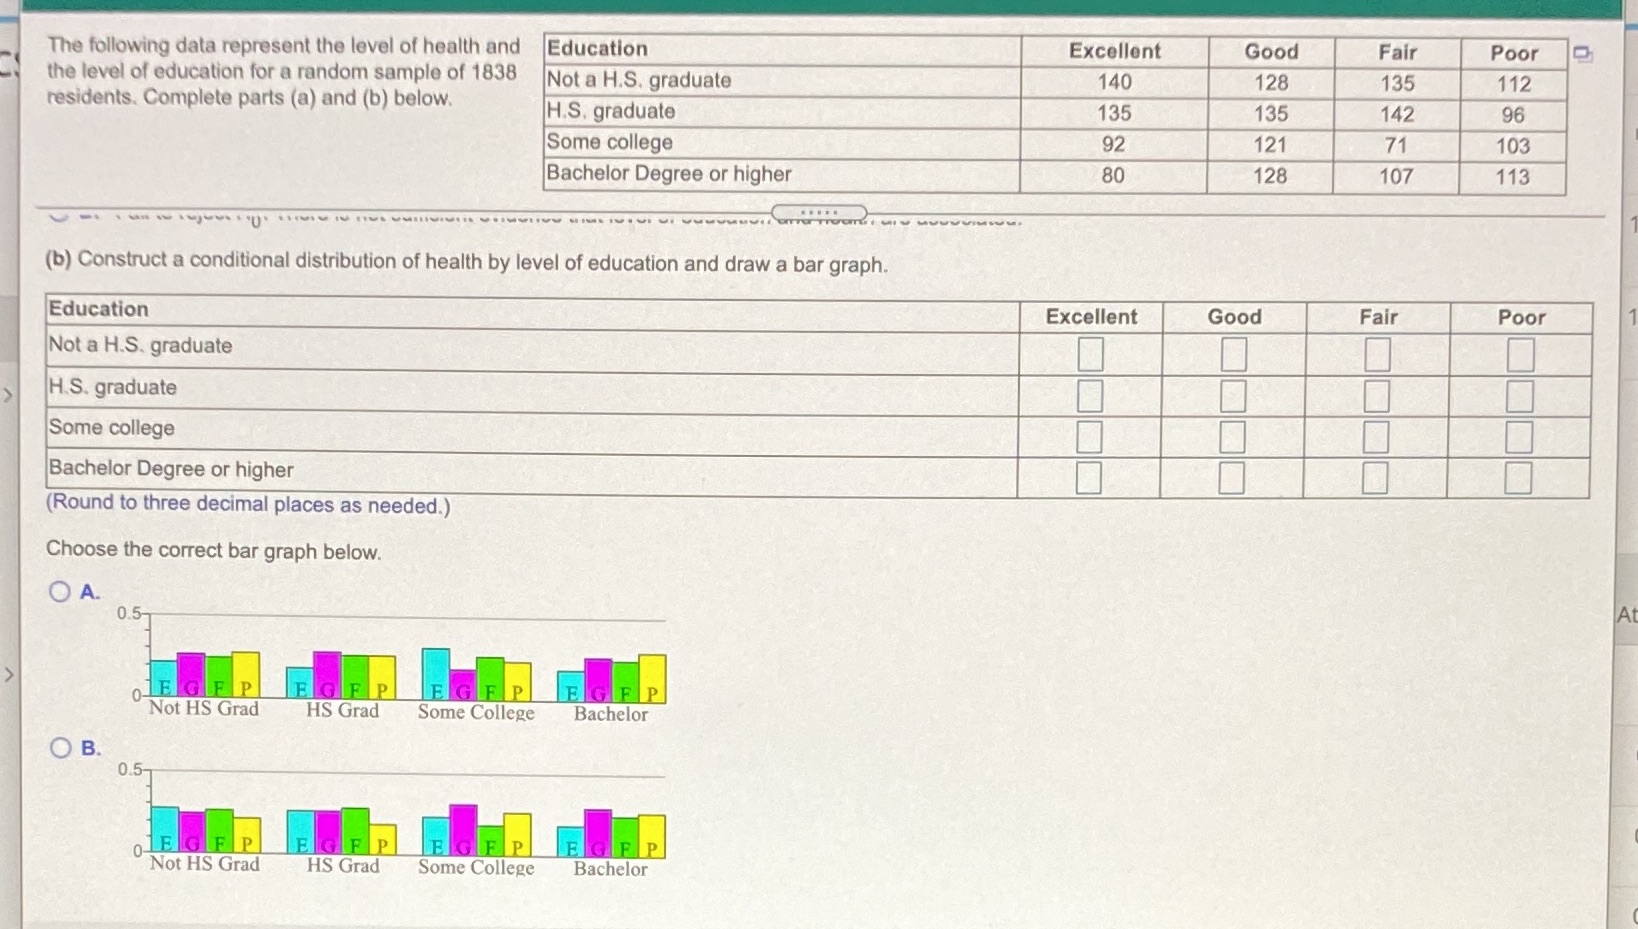
The following data represent the level of health and Education Excellent Good Fair Poor the level of education for a random sample of 1838 Not a H.S. graduate 140 128 135 112 residents. Complete parts (a) and (b) below. H.S. graduate 135 135 142 96 Some college 92 121 71 103 Bachelor Degree or higher 80 128 107 113 (b) Construct a conditional distribution of health by level of education and draw a bar graph. Education Excellent Good Fair Poor Not a H.S. graduate H.S. graduate Some college Bachelor Degree or higher (Round to three decimal places as needed.) Choose the correct bar graph below. O A. 0.5- JE G FP F G FP G FP F G FP Not HS Grad HS Grad Some College Bachelor OB. 0.5- F G FP EG P P G FP Not HS Grad HS Grad Some College Bachelor
Step by Step Solution
There are 3 Steps involved in it

Get step-by-step solutions from verified subject matter experts