

Question: Calculate the WACC for HFC using the data provided in the exhibits; assume a Market Risk Premium of 5.5% -20- UVA-F-1409 Exhibit 9 HERSHEY FOODS
Calculate the WACC for HFC using the data provided in the exhibits; assume a Market Risk Premium of 5.5%
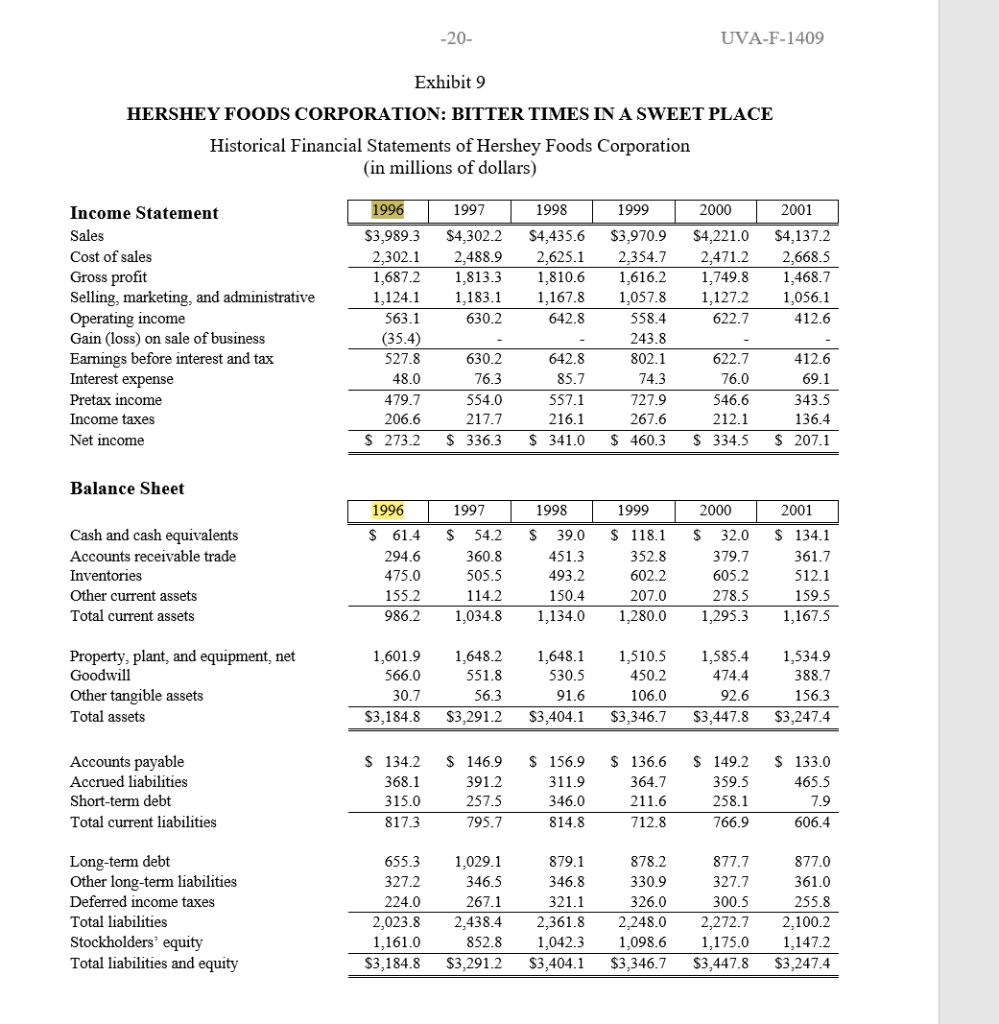
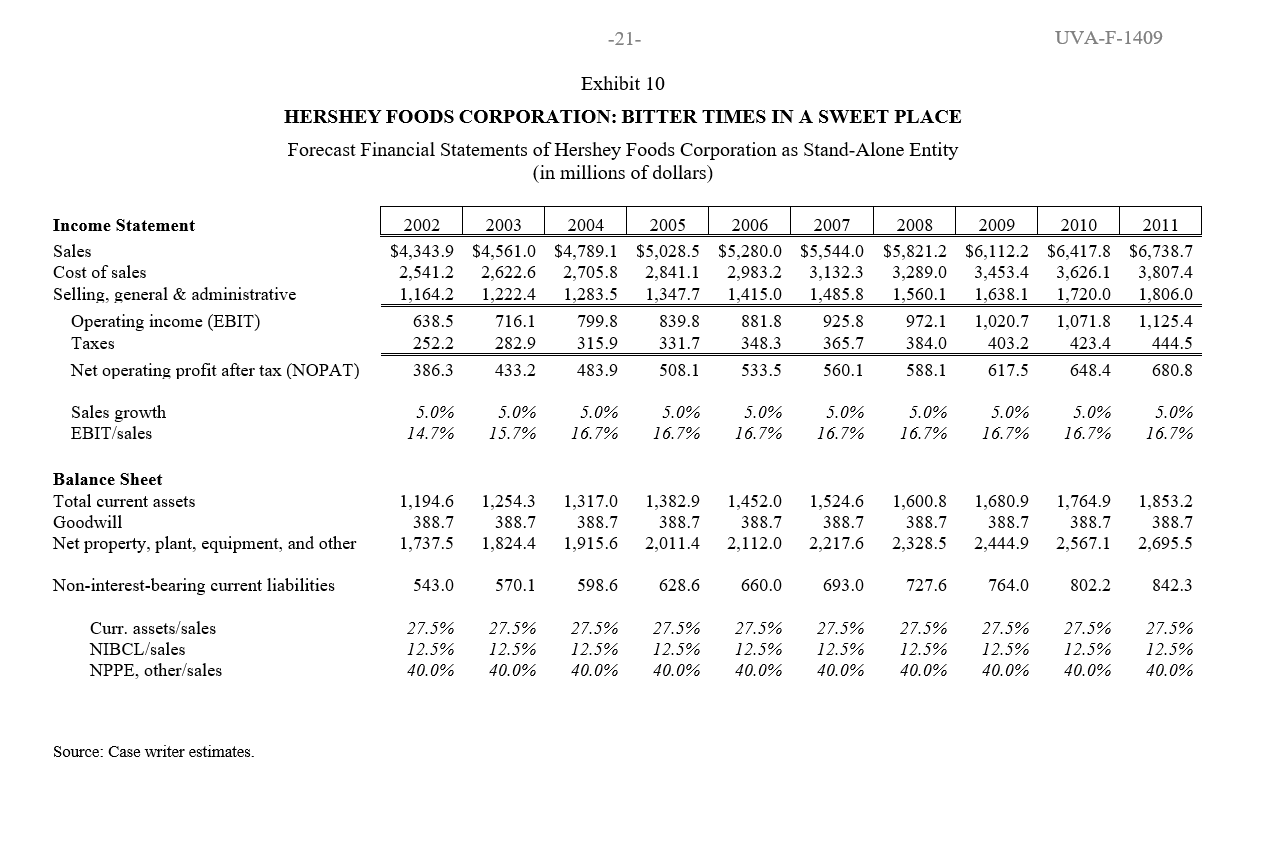
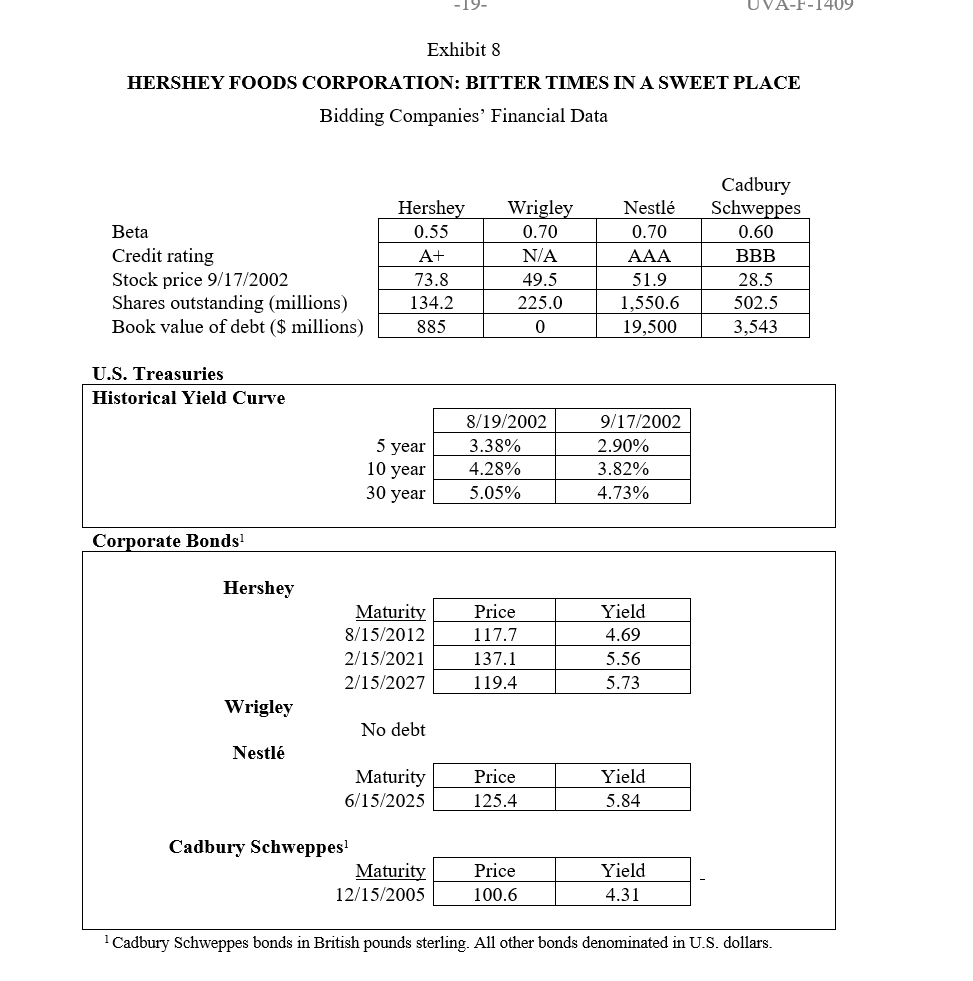
-20- UVA-F-1409 Exhibit 9 HERSHEY FOODS CORPORATION: BITTER TIMES IN A SWEET PLACE Historical Financial Statements of Hershey Foods Corporation (in millions of dollars) 1996 1998 1999 2000 2001 $3,970.9 1997 $4,302.2 2,488.9 1,813.3 1,183.1 630.2 2,354.7 $4,435.6 2,625.1 1,810.6 1,167.8 642.8 $4,221.0 2,471.2 1,749.8 1,127.2 622.7 $4.137.2 2,668.5 1,468.7 1,056.1 412.6 Income Statement Sales Cost of sales Gross profit Selling, marketing, and administrative Operating income Gain (loss) on sale of business Earnings before interest and tax Interest expense Pretax income Income taxes Net income $3,989.3 2,302.1 1,687.2 1,124.1 563.1 (35.4) 527.8 48.0 479.7 206.6 $ 273.2 630.2 76.3 554.0 217.7 $ 336.3 622.7 76.0 1,616.2 1,057.8 558.4 243.8 802.1 74.3 727.9 267.6 $ 460.3 642.8 85.7 557.1 216.1 $ 341.0 546.6 412.6 69.1 343.5 136.4 $ 207.1 212.1 $ 334.5 Balance Sheet 1998 1999 2000 2001 Cash and cash equivalents Accounts receivable trade Inventories Other current assets Total current assets 1996 $ 61.4 294.6 475.0 155.2 986.2 1997 $ 54.2 360.8 505.5 114.2 1,034.8 $ 39.0 451.3 493.2 150.4 1,134.0 $ 118.1 352.8 602.2 207.0 1,280.0 $ 32.0 379.7 605.2 278.5 1,295.3 $ 134.1 361.7 512.1 159.5 1,167.5 Property, plant, and equipment, net Goodwill Other tangible assets Total assets 1,601.9 566.0 30.7 $3,184.8 1,648.2 551.8 56.3 $3,291.2 1,648.1 530.5 91.6 $3,404.1 1,510.5 450.2 106.0 $3,346.7 1,585.4 474.4 92.6 $3,447.8 1,534.9 388.7 156.3 $3,247.4 Accounts payable Accrued liabilities Short-term debt Total current liabilities $ 134.2 368.1 315.0 817.3 $ 146.9 391.2 257.5 795.7 $ 156.9 311.9 346.0 814.8 $ 136.6 364.7 211.6 712.8 $ 149.2 359.5 258.1 766.9 $ 133.0 465.5 7.9 606.4 Long-term debt Other long-term liabilities Deferred income taxes Total liabilities Stockholders' equity Total liabilities and equity 655.3 327.2 224.0 2,023.8 1,161.0 $3,184.8 1,029.1 346.5 267.1 2,438.4 852.8 $3,291.2 879.1 346.8 321.1 2,361.8 1,042.3 $3,404.1 878.2 330.9 326.0 2,248.0 1,098.6 $3,346.7 877.7 327.7 300.5 2,272.7 1,175.0 $3,447.8 877.0 361.0 255.8 2,100.2 1,147.2 $3,247.4 -21- UVA-F-1409 Exhibit 10 HERSHEY FOODS CORPORATION: BITTER TIMES IN A SWEET PLACE Forecast Financial Statements of Hershey Foods Corporation as Stand-Alone Entity (in millions of dollars) Income Statement Sales Cost of sales Selling, general & administrative Operating income (EBIT) Taxes Net operating profit after tax (NOPAT) 2002 2003 2004 2005 2006 2007 2008 $4,343.9 $4,561.0 $4,789.1 $5,028.5 $5,280.0 $5,544.0 $5,821.2 2,541.2 2,622.6 2,705.8 2,841.1 2,983.2 3,132.3 3,289.0 1,164.2 1,222.4 1,283.5 1,347.7 1,415.0 1,485.8 1,560.1 638.5 716.1 799.8 839.8 881.8 925.8 972.1 252.2 282.9 315.9 331.7 348.3 365.7 384.0 386.3 433.2 483.9 508.1 533.5 560.1 588.1 2009 2010 2011 $6,112.2 $6,417.8 $6,738.7 3,453.4 3,626.1 3,807.4 1,638.1 1,720.0 1,806.0 1,020.7 1,071.8 1,125.4 403.2 423.4 444.5 617.5 648.4 680.8 Sales growth EBIT/sales 5.0% 14.7% 5.0% 15.7% 5.0% 16.7% 5.0% 16.7% 5.0% 16.7% 5.0% 16.7% 5.0% 16.7% 5.0% 16.7% 5.0% 16.7% 5.0% 16.7% Balance Sheet Total current assets Goodwill Net property, plant, equipment, and other 1,194.6 388.7 1,737.5 1,254.3 388.7 1,824.4 1,317.0 388.7 1,915.6 1,382.9 388.7 2,011.4 1,452.0 388.7 2,112.0 1,524.6 388.7 2,217.6 1,600.8 388.7 2,328.5 1,680.9 388.7 2,444.9 1,764.9 388.7 2,567.1 1,853.2 388.7 2,695.5 Non-interest-bearing current liabilities 543.0 570.1 598.6 628.6 660.0 693.0 727.6 764.0 802.2 842.3 Curr, assets/sales NIBCL/sales NPPE, other/sales 27.5% 12.5% 40.0% 27.5% 12.5% 40.0% 27.5% 12.5% 40.0% 27.5% 12.5% 40.0% 27.5% 12.5% 40.0% 27.5% 12.5% 40.0% 27.5% 12.5% 40.0% 27.5% 12.5% 40.0% 27.5% 12.5% 40.0% 27.5% 12.5% 40.0% Source: Case writer estimates. -19- UVA-F-1409 Exhibit 8 HERSHEY FOODS CORPORATION: BITTER TIMES IN A SWEET PLACE Bidding Companies' Financial Data Beta Credit rating Stock price 9/17/2002 Shares outstanding (millions) Book value of debt ($ millions) Hershey 0.55 A+ 73.8 134.2 885 Wrigley 0.70 N/A 49.5 225.0 Nestl 0.70 AAA 51.9 1,550.6 19,500 Cadbury Schweppes 0.60 BBB 28.5 502.5 3,543 0 U.S. Treasuries Historical Yield Curve 5 year 10 year 30 year 8/19/2002 3.38% 4.28% 5.05% 9/17/2002 2.90% 3.82% 4.73% Corporate Bonds! Hershey Maturity 8/15/2012 2/15/2021 2/15/2027 Price 117.7 137.1 119.4 Yield 4.69 5.56 5.73 Wrigley No debt Nestl Maturity 6/15/2025 Price 125.4 Yield 5.84 Cadbury Schweppes! Maturity 12/15/2005 Price 100.6 Yield 4.31 Cadbury Schweppes bonds in British pounds sterling. All other bonds denominated in U.S. dollars. -20- UVA-F-1409 Exhibit 9 HERSHEY FOODS CORPORATION: BITTER TIMES IN A SWEET PLACE Historical Financial Statements of Hershey Foods Corporation (in millions of dollars) 1996 1998 1999 2000 2001 $3,970.9 1997 $4,302.2 2,488.9 1,813.3 1,183.1 630.2 2,354.7 $4,435.6 2,625.1 1,810.6 1,167.8 642.8 $4,221.0 2,471.2 1,749.8 1,127.2 622.7 $4.137.2 2,668.5 1,468.7 1,056.1 412.6 Income Statement Sales Cost of sales Gross profit Selling, marketing, and administrative Operating income Gain (loss) on sale of business Earnings before interest and tax Interest expense Pretax income Income taxes Net income $3,989.3 2,302.1 1,687.2 1,124.1 563.1 (35.4) 527.8 48.0 479.7 206.6 $ 273.2 630.2 76.3 554.0 217.7 $ 336.3 622.7 76.0 1,616.2 1,057.8 558.4 243.8 802.1 74.3 727.9 267.6 $ 460.3 642.8 85.7 557.1 216.1 $ 341.0 546.6 412.6 69.1 343.5 136.4 $ 207.1 212.1 $ 334.5 Balance Sheet 1998 1999 2000 2001 Cash and cash equivalents Accounts receivable trade Inventories Other current assets Total current assets 1996 $ 61.4 294.6 475.0 155.2 986.2 1997 $ 54.2 360.8 505.5 114.2 1,034.8 $ 39.0 451.3 493.2 150.4 1,134.0 $ 118.1 352.8 602.2 207.0 1,280.0 $ 32.0 379.7 605.2 278.5 1,295.3 $ 134.1 361.7 512.1 159.5 1,167.5 Property, plant, and equipment, net Goodwill Other tangible assets Total assets 1,601.9 566.0 30.7 $3,184.8 1,648.2 551.8 56.3 $3,291.2 1,648.1 530.5 91.6 $3,404.1 1,510.5 450.2 106.0 $3,346.7 1,585.4 474.4 92.6 $3,447.8 1,534.9 388.7 156.3 $3,247.4 Accounts payable Accrued liabilities Short-term debt Total current liabilities $ 134.2 368.1 315.0 817.3 $ 146.9 391.2 257.5 795.7 $ 156.9 311.9 346.0 814.8 $ 136.6 364.7 211.6 712.8 $ 149.2 359.5 258.1 766.9 $ 133.0 465.5 7.9 606.4 Long-term debt Other long-term liabilities Deferred income taxes Total liabilities Stockholders' equity Total liabilities and equity 655.3 327.2 224.0 2,023.8 1,161.0 $3,184.8 1,029.1 346.5 267.1 2,438.4 852.8 $3,291.2 879.1 346.8 321.1 2,361.8 1,042.3 $3,404.1 878.2 330.9 326.0 2,248.0 1,098.6 $3,346.7 877.7 327.7 300.5 2,272.7 1,175.0 $3,447.8 877.0 361.0 255.8 2,100.2 1,147.2 $3,247.4 -21- UVA-F-1409 Exhibit 10 HERSHEY FOODS CORPORATION: BITTER TIMES IN A SWEET PLACE Forecast Financial Statements of Hershey Foods Corporation as Stand-Alone Entity (in millions of dollars) Income Statement Sales Cost of sales Selling, general & administrative Operating income (EBIT) Taxes Net operating profit after tax (NOPAT) 2002 2003 2004 2005 2006 2007 2008 $4,343.9 $4,561.0 $4,789.1 $5,028.5 $5,280.0 $5,544.0 $5,821.2 2,541.2 2,622.6 2,705.8 2,841.1 2,983.2 3,132.3 3,289.0 1,164.2 1,222.4 1,283.5 1,347.7 1,415.0 1,485.8 1,560.1 638.5 716.1 799.8 839.8 881.8 925.8 972.1 252.2 282.9 315.9 331.7 348.3 365.7 384.0 386.3 433.2 483.9 508.1 533.5 560.1 588.1 2009 2010 2011 $6,112.2 $6,417.8 $6,738.7 3,453.4 3,626.1 3,807.4 1,638.1 1,720.0 1,806.0 1,020.7 1,071.8 1,125.4 403.2 423.4 444.5 617.5 648.4 680.8 Sales growth EBIT/sales 5.0% 14.7% 5.0% 15.7% 5.0% 16.7% 5.0% 16.7% 5.0% 16.7% 5.0% 16.7% 5.0% 16.7% 5.0% 16.7% 5.0% 16.7% 5.0% 16.7% Balance Sheet Total current assets Goodwill Net property, plant, equipment, and other 1,194.6 388.7 1,737.5 1,254.3 388.7 1,824.4 1,317.0 388.7 1,915.6 1,382.9 388.7 2,011.4 1,452.0 388.7 2,112.0 1,524.6 388.7 2,217.6 1,600.8 388.7 2,328.5 1,680.9 388.7 2,444.9 1,764.9 388.7 2,567.1 1,853.2 388.7 2,695.5 Non-interest-bearing current liabilities 543.0 570.1 598.6 628.6 660.0 693.0 727.6 764.0 802.2 842.3 Curr, assets/sales NIBCL/sales NPPE, other/sales 27.5% 12.5% 40.0% 27.5% 12.5% 40.0% 27.5% 12.5% 40.0% 27.5% 12.5% 40.0% 27.5% 12.5% 40.0% 27.5% 12.5% 40.0% 27.5% 12.5% 40.0% 27.5% 12.5% 40.0% 27.5% 12.5% 40.0% 27.5% 12.5% 40.0% Source: Case writer estimates. -19- UVA-F-1409 Exhibit 8 HERSHEY FOODS CORPORATION: BITTER TIMES IN A SWEET PLACE Bidding Companies' Financial Data Beta Credit rating Stock price 9/17/2002 Shares outstanding (millions) Book value of debt ($ millions) Hershey 0.55 A+ 73.8 134.2 885 Wrigley 0.70 N/A 49.5 225.0 Nestl 0.70 AAA 51.9 1,550.6 19,500 Cadbury Schweppes 0.60 BBB 28.5 502.5 3,543 0 U.S. Treasuries Historical Yield Curve 5 year 10 year 30 year 8/19/2002 3.38% 4.28% 5.05% 9/17/2002 2.90% 3.82% 4.73% Corporate Bonds! Hershey Maturity 8/15/2012 2/15/2021 2/15/2027 Price 117.7 137.1 119.4 Yield 4.69 5.56 5.73 Wrigley No debt Nestl Maturity 6/15/2025 Price 125.4 Yield 5.84 Cadbury Schweppes! Maturity 12/15/2005 Price 100.6 Yield 4.31 Cadbury Schweppes bonds in British pounds sterling. All other bonds denominated in U.S. dollars
Step by Step Solution
There are 3 Steps involved in it

Get step-by-step solutions from verified subject matter experts