

Question: Calculate the WACC for HFC using the data provided in the exhibits; assume a Market Risk Premium of 5.5%. Estimate the stand-alone value of HFC
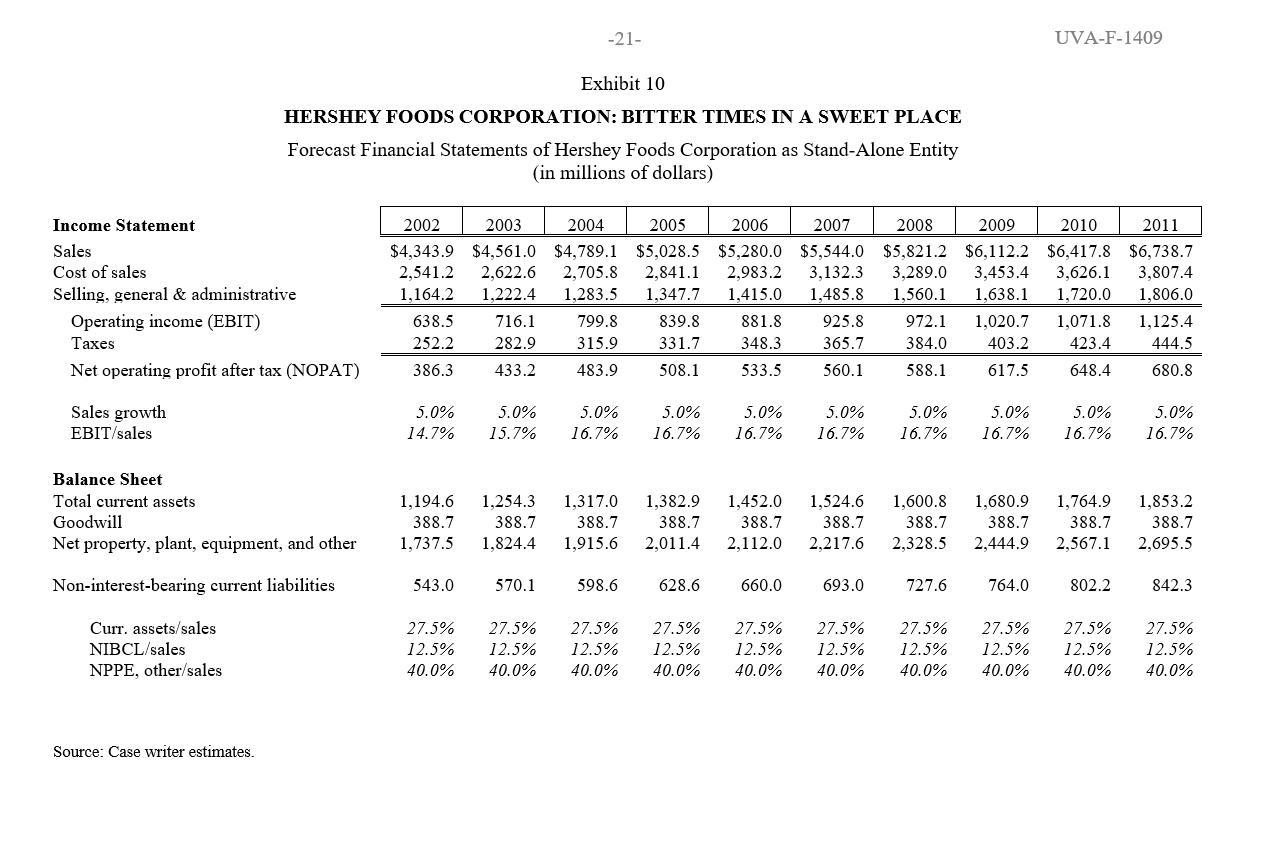
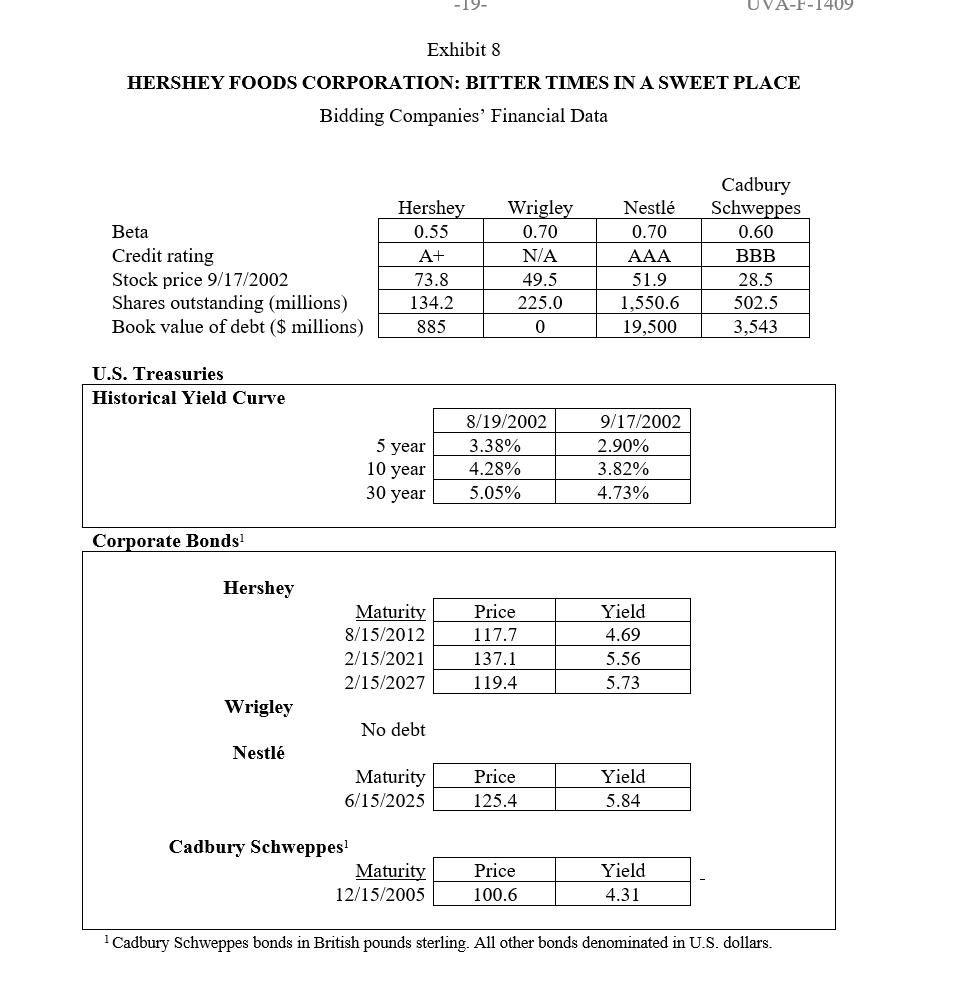
Calculate the WACC for HFC using the data provided in the exhibits; assume a Market Risk Premium of 5.5%. Estimate the stand-alone value of HFC using the free-cash-flow projections provided in case Exhibit 10.
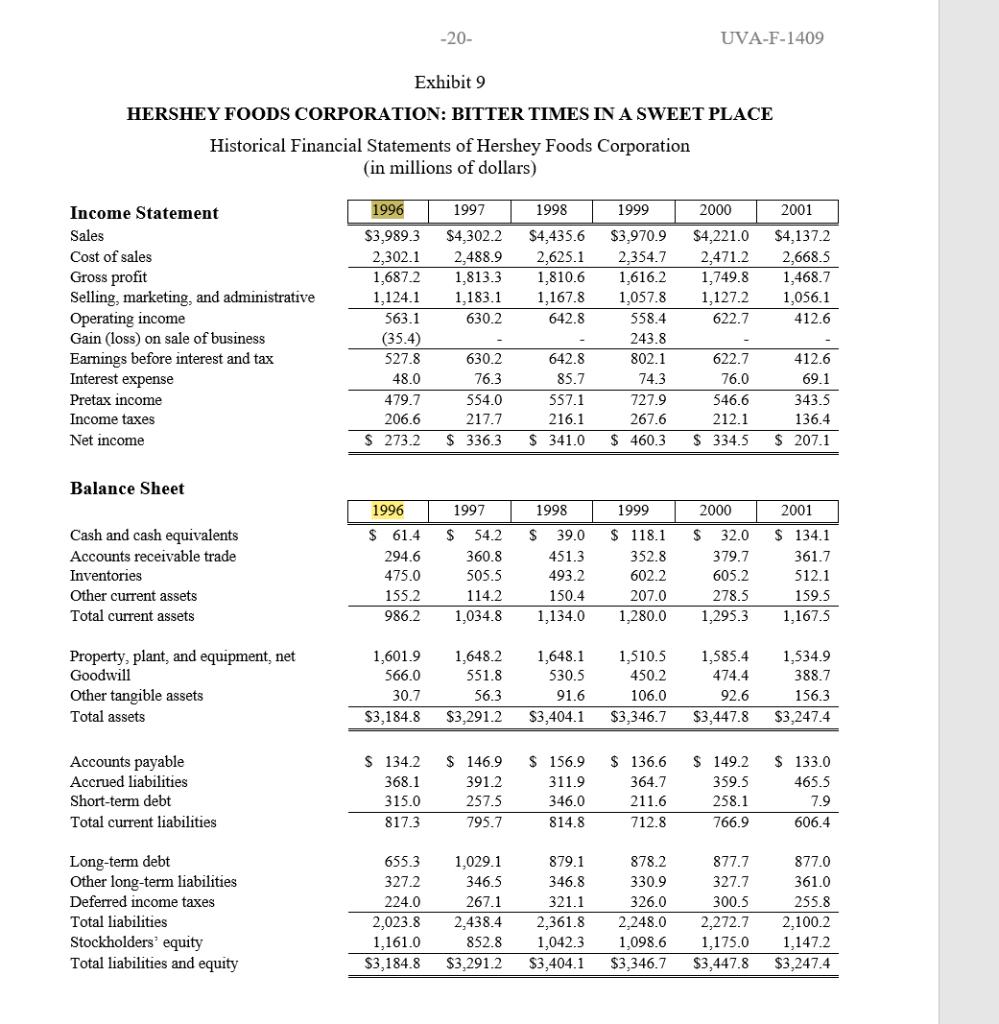
Income Statement Sales Cost of sales Gross profit Selling, marketing, and administrative Operating income Exhibit 9 HERSHEY FOODS CORPORATION: BITTER TIMES IN A SWEET PLACE Historical Financial Statements of Hershey Foods Corporation (in millions of dollars) Gain (loss) on sale of business Earnings before interest and tax Interest expense Pretax income Income taxes Net income Balance Sheet Cash and cash equivalents Accounts receivable trade Inventories Other current assets Total current assets Property, plant, and equipment, net Goodwill Other tangible assets Total assets Accounts payable Accrued liabilities Short-term debt Total current liabilities Long-term debt Other long-term liabilities Deferred income taxes Total liabilities Stockholders' equity Total liabilities and equity 1996 1997 $3,989.3 $4,302.2 2,302.1 2,488.9 1,687.2 1,813.3 1,124.1 1,183.1 630.2 563.1 (35.4) 527.8 48.0 479.7 206.6 $ 273.2 -20- 1,601.9 566.0 30.7 $3,184.8 S 134.2 368.1 315.0 817.3 630.2 76.3 554.0 217.7 $ 336.3 $ 341.0 1996 1997 1998 $ 61.4 $ 54.2 $ 39.0 294.6 360.8 451.3 475.0 505.5 493.2 155.2 114.2 150.4 986.2 1,034.8 1,134.0 1,648.2 551.8 56.3 $3,291.2 1999 2000 1998 $4,435.6 $3,970.9 $4,221.0 2,625.1 2,354.7 2,471.2 1,810.6 1,616.2 1,749.8 1,167.8 1,057.8 1,127.2 642.8 622.7 642.8 85.7 $ 146.9 391.2 257.5 795.7 557.1 216.1 1,648.1 530.5 91.6 $3,404.1 $ 156.9 311.9 346.0 814.8 UVA-F-1409 558.4 243.8 802.1 74.3 727.9 267.6 $ 460.3 622.7 76.0 546.6 212.1 $ 334.5 1999 2000 $118.1. $ 32.0 352.8 379.7 602.2 605.2 207.0 278.5 1,280.0 1,295.3 $ 136.6 364.7 211.6 712.8 1,510.5 450.2 106.0 $3,346.7 $3,447.8 1,585.4 474.4 92.6 $ 149.2 359.5 258.1 766.9 655.3 1,029.1 879.1 878.2 877.7 327.2 346.5 346.8 330.9 327.7 224.0 326.0 300.5 267.1 321.1 2,438.4 2,361.8 2,248.0 2,272.7 2,023.8 1,161.0 852.8 $3,184.8 $3,291.2 1,042.3 1,098.6 1,175.0 $3,404.1 $3,346.7 $3,447.8 2001 $4,137.2 2,668.5 1,468.7 1,056.1 412.6 412.6 69.1 343.5 136.4 $ 207.1 2001 $ 134.1 361.7 512.1 159.5 1,167.5 1,534.9 388.7 156.3 $3,247.4 $ 133.0 465.5 7.9 606.4 877.0 361.0 255.8 2,100.2 1,147.2 $3,247.4
Step by Step Solution
3.50 Rating (167 Votes )
There are 3 Steps involved in it
The Hershey Company was not fairly valued by the market before the announcement of the sale The intrinsic value of the company was 2445 million which ... View full answer

Get step-by-step solutions from verified subject matter experts
Document Format (2 attachments)
6364b088d8d7b_214925.pdf
180 KBs PDF File
6364b088d8d7b_214925.docx
120 KBs Word File