

Question: Calculate these three problems. The following data shows the amount of chocolate Mrs. Latimer ate over the last 30 days. in N m N HN

Calculate these three problems.
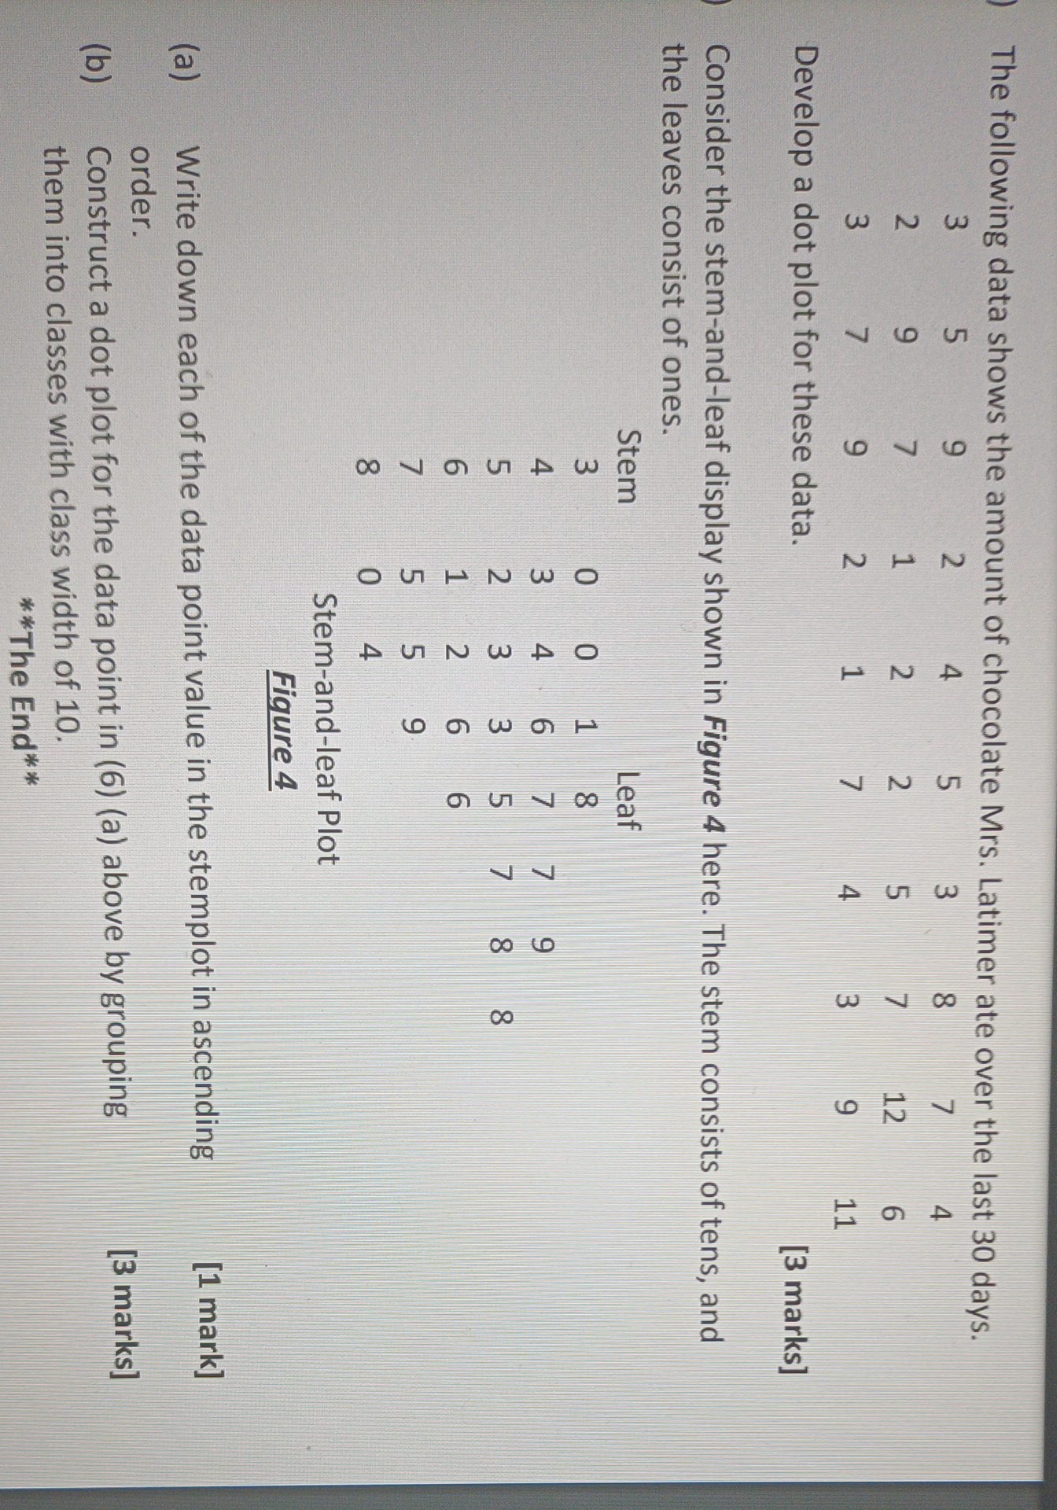
The following data shows the amount of chocolate Mrs. Latimer ate over the last 30 days. in N m N HN 00 M m Develop a dot plot for these data. [3 marks] Consider the stem-and-leaf display shown in Figure 4 here. The stem consists of tens, and the leaves consist of ones. Stem Leaf HUm Um CO OmNHLO omNut Stem-and-leaf Plot Figure 4 Write down each of the data point value in the stemplot in ascending [1 mark] order. Construct a dot plot for the data point in (6) (a) above by grouping [3 marks] them into classes with class width of 10. * *The End* *
Step by Step Solution
There are 3 Steps involved in it
1 Expert Approved Answer
Step: 1 Unlock

Question Has Been Solved by an Expert!
Get step-by-step solutions from verified subject matter experts
Step: 2 Unlock
Step: 3 Unlock