

Calculate This Year Ratio's and Last Year Ratio's and indicate any change, if any that should...
Fantastic news! We've Found the answer you've been seeking!
Question:
Transcribed Image Text:
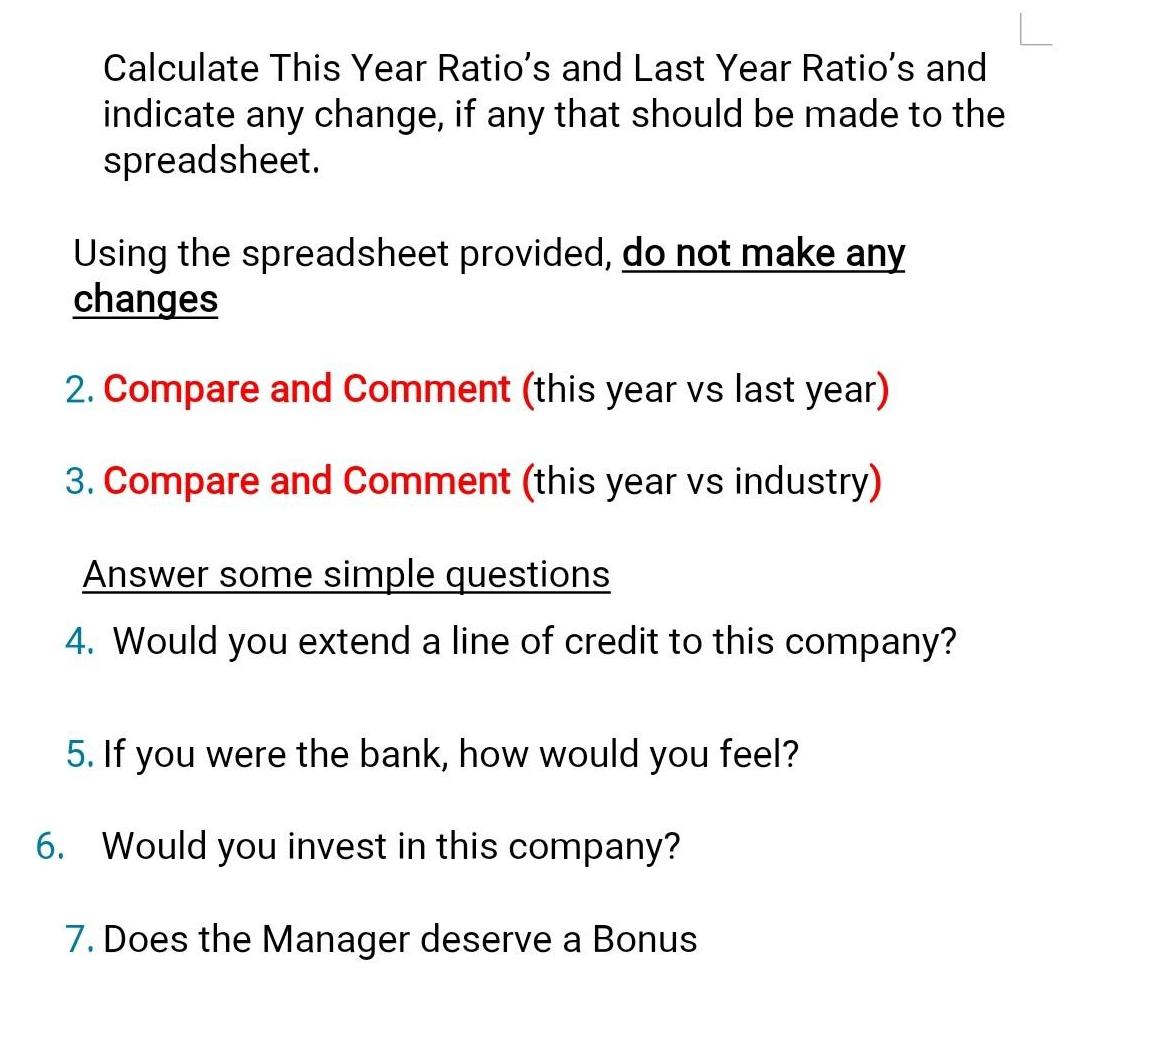
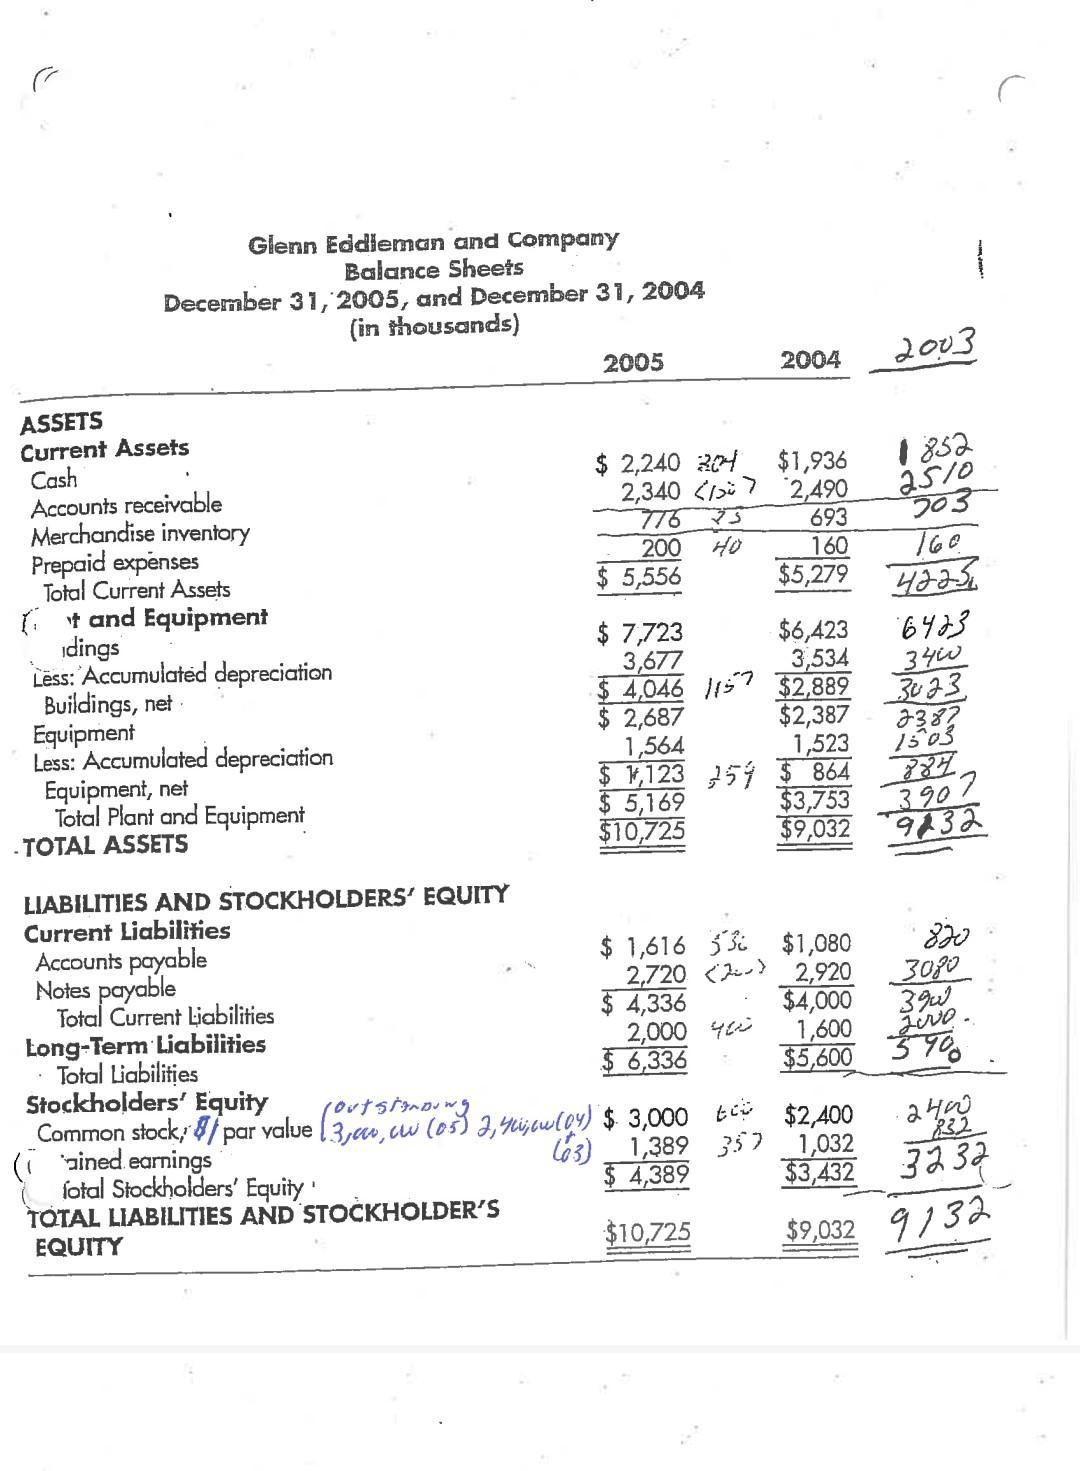
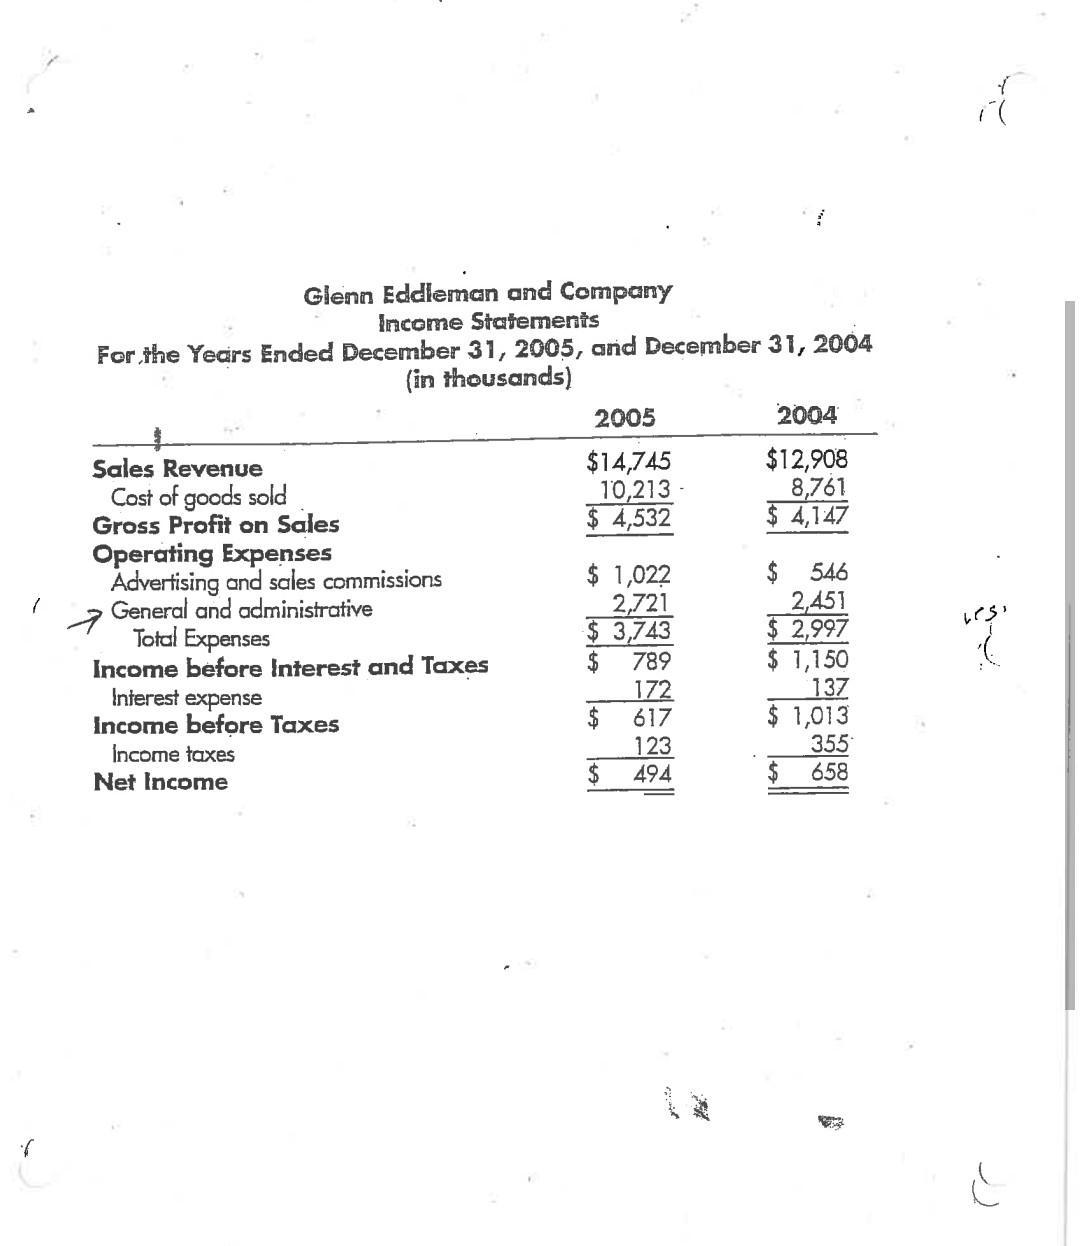
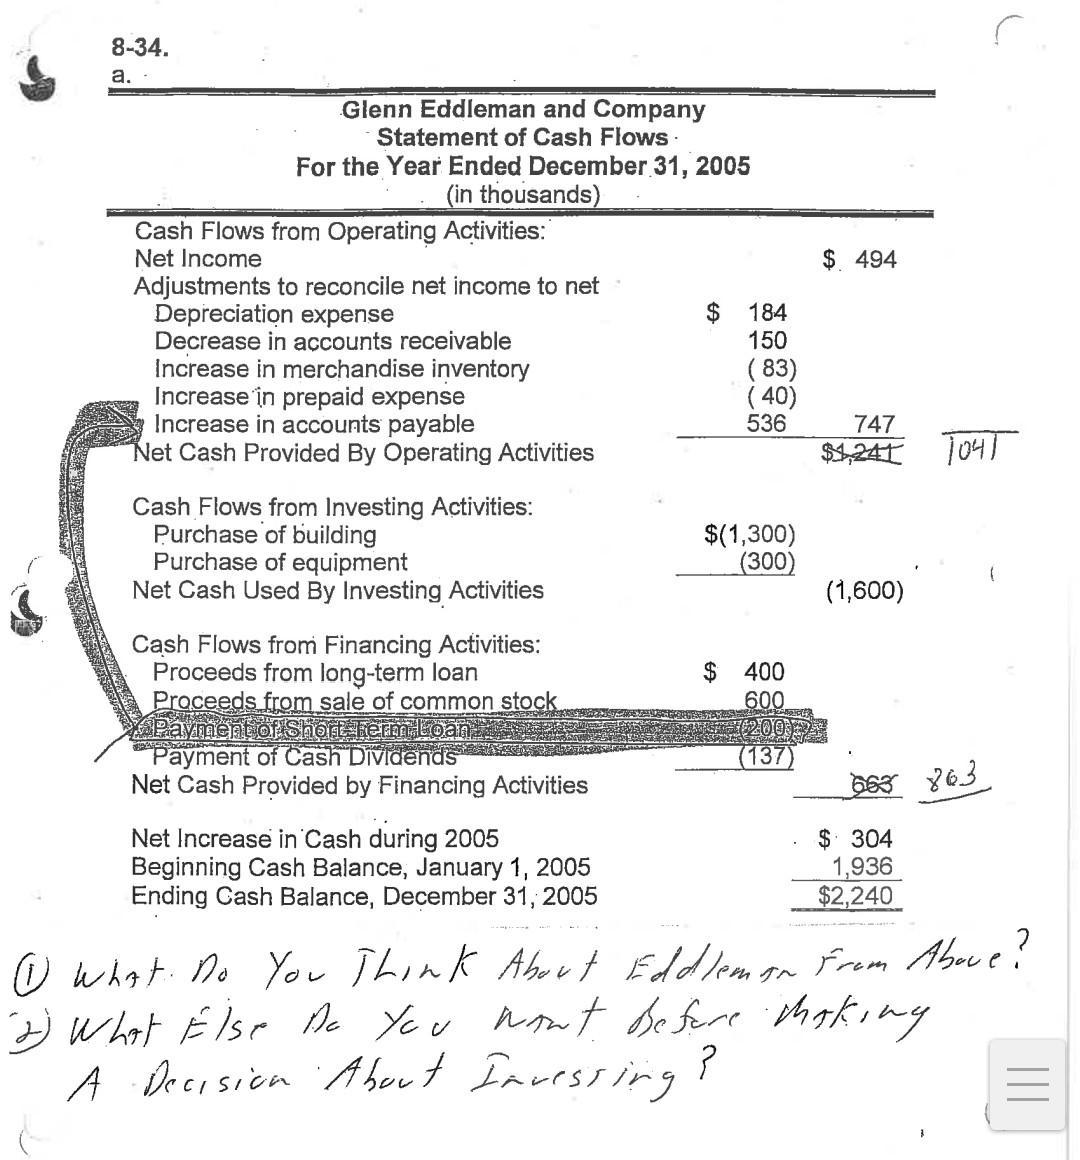
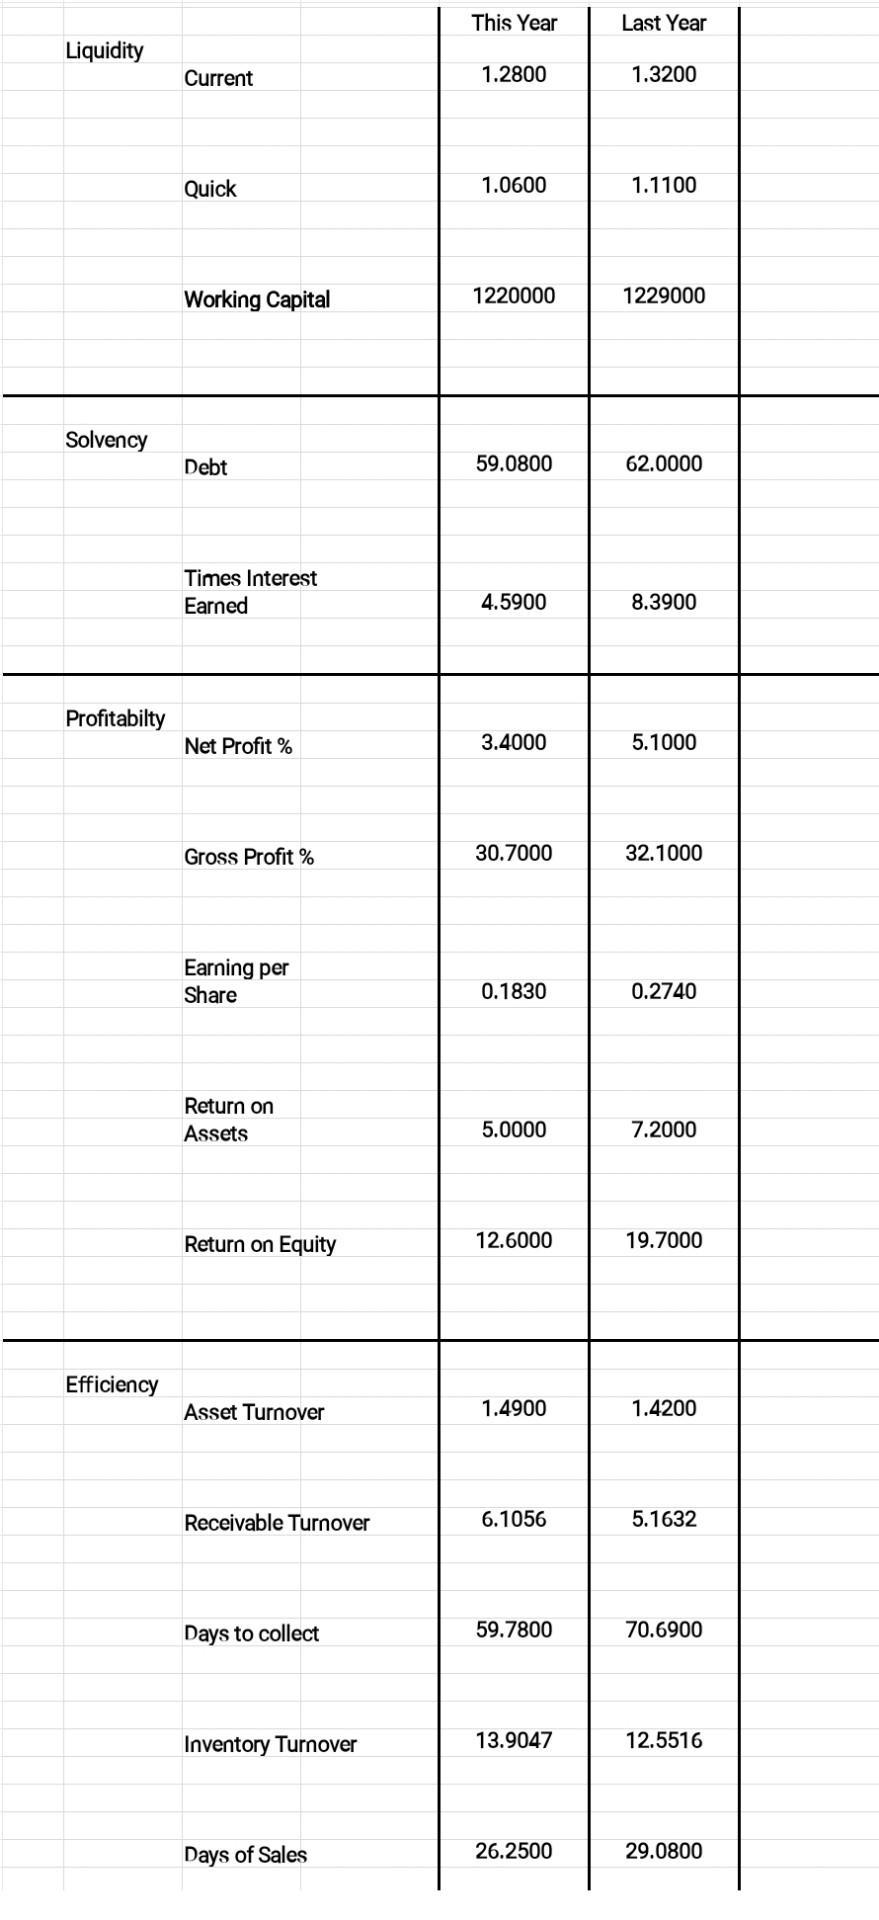
Calculate This Year Ratio's and Last Year Ratio's and indicate any change, if any that should be made to the spreadsheet. Using the spreadsheet provided, do not make any changes 2. Compare and Comment (this year vs last year) 3. Compare and Comment (this year vs industry) Answer some simple questions 4. Would you extend a line of credit to this company? 5. If you were the bank, how would you feel? 6. Would you invest in this company? 7. Does the Manager deserve a Bonus December 31, 2005, and December 31, 2004 (in thousands) ASSETS Current Assets Cash Glenn Eddieman and Company Balance Sheets Accounts receivable Merchandise inventory Prepaid expenses Total Current Assets It and Equipment idings Less: Accumulated depreciation Buildings, net Equipment Less: Accumulated depreciation Equipment, net Total Plant and Equipment TOTAL ASSETS LIABILITIES AND STOCKHOLDERS' EQUITY Current Liabilities Accounts payable Notes payable Total Current Liabilities Long-Term Liabilities Total Liabilities Stockholders' Equity Common stock, / par value (3,, c 2005 (ained earnings fotal Stockholders' Equity' TOTAL LIABILITIES AND STOCKHOLDER'S EQUITY $2,240 24 2,340 < 776 200 $ 5,556 75 40 $1,616 53 2,720 < $ 4,336 $ 7,723 $6,423 3,534 3,677 $4,046 157 $2,889 $ 2,687 $2,387 1,564 1,523 $1,123 25 $ 864 $5,169 $10,725 2,000 400 $6,336 (out STAND 2,40;cu (04) $3,000 t 2004 (63) 1,389 357 4,389 $10,725 $1,936 2,490 693 160 $5,279 $3,753 $9,032 2003 1852 2510 503 160 4225 6423 340 3023 2387 1503 384 +3907 9232 820 $1,080 2,920 3080 $4,000 390 Juve. 1,600 $5,600 370 $2,400 24000 1,032 832 $3,432 3232 $9,032 9132 1 Glenn Eddleman and Company Income Statements For the Years Ended December 31, 2005, and December 31, 2004 (in thousands) Sales Revenue Cost of goods sold Gross Profit on Sales Operating Expenses Advertising and sales commissions General and administrative Total Expenses Income before Interest and Taxes 7 Interest expense Income before Taxes Income taxes Net Income 2005 $14,745 10,213 $4,532 $ 1,022 2,721 $3,743 $ 789 172 $ 617 123 494 $ 2. 2004 $12,908 8,761 $ 4,147 546 2,451 $2,997 $ 1,150 137 $ 1,013 355 $ 658 Les 8-34. a. Glenn Eddleman and Company Statement of Cash Flows For the Year Ended December 31, 2005 (in thousands) Cash Flows from Operating Activities: Net Income Adjustments to reconcile net income to net Depreciation expense Decrease in accounts receivable Increase in merchandise inventory Increase in prepaid expense Increase in accounts payable Net Cash Provided By Operating Activities Cash Flows from Investing Activities: Purchase of building Purchase of equipment Net Cash Used By Investing Activities Cash Flows from Financing Activities: Proceeds from long-term loan Proceeds from sale of common stock Payment of Short-Term Loan... Payment of Cash Dividends Net Cash Provided by Financing Activities Net Increase in Cash during 2005 Beginning Cash Balance, January 1, 2005 Ending Cash Balance, December 31, 2005 $184 150 (83) (40) 536 $(1,300) (300) $ 400 600 PARKASTE (200)2 (137) $ 494 747 $1,241 104T (1,600) 563 863 $ 304 1,936 $2,240 ☺) What Do You Think About Eddlemon From Above? 2) What Else Do You wont before making A Decision About Invessing? Liquidity Solvency Profitabilty Efficiency Current Quick Working Capital Debt Times Interest Earned Net Profit % Gross Profit % Earning per Share Return on Assets Return on Equity Asset Turnover Receivable Turnover Days to collect Inventory Turnover Days of Sales This Year 1.2800 1.0600 1220000 59.0800 4.5900 3.4000 30.7000 0.1830 5.0000 12.6000 1.4900 6.1056 59.7800 13.9047 26.2500 Last Year 1.3200 1.1100 1229000 62.0000 8.3900 5.1000 32.1000 0.2740 7.2000 19.7000 1.4200 5.1632 70.6900 12.5516 29.0800 Calculate This Year Ratio's and Last Year Ratio's and indicate any change, if any that should be made to the spreadsheet. Using the spreadsheet provided, do not make any changes 2. Compare and Comment (this year vs last year) 3. Compare and Comment (this year vs industry) Answer some simple questions 4. Would you extend a line of credit to this company? 5. If you were the bank, how would you feel? 6. Would you invest in this company? 7. Does the Manager deserve a Bonus December 31, 2005, and December 31, 2004 (in thousands) ASSETS Current Assets Cash Glenn Eddieman and Company Balance Sheets Accounts receivable Merchandise inventory Prepaid expenses Total Current Assets It and Equipment idings Less: Accumulated depreciation Buildings, net Equipment Less: Accumulated depreciation Equipment, net Total Plant and Equipment TOTAL ASSETS LIABILITIES AND STOCKHOLDERS' EQUITY Current Liabilities Accounts payable Notes payable Total Current Liabilities Long-Term Liabilities Total Liabilities Stockholders' Equity Common stock, / par value (3,, c 2005 (ained earnings fotal Stockholders' Equity' TOTAL LIABILITIES AND STOCKHOLDER'S EQUITY $2,240 24 2,340 < 776 200 $ 5,556 75 40 $1,616 53 2,720 < $ 4,336 $ 7,723 $6,423 3,534 3,677 $4,046 157 $2,889 $ 2,687 $2,387 1,564 1,523 $1,123 25 $ 864 $5,169 $10,725 2,000 400 $6,336 (out STAND 2,40;cu (04) $3,000 t 2004 (63) 1,389 357 4,389 $10,725 $1,936 2,490 693 160 $5,279 $3,753 $9,032 2003 1852 2510 503 160 4225 6423 340 3023 2387 1503 384 +3907 9232 820 $1,080 2,920 3080 $4,000 390 Juve. 1,600 $5,600 370 $2,400 24000 1,032 832 $3,432 3232 $9,032 9132 1 Glenn Eddleman and Company Income Statements For the Years Ended December 31, 2005, and December 31, 2004 (in thousands) Sales Revenue Cost of goods sold Gross Profit on Sales Operating Expenses Advertising and sales commissions General and administrative Total Expenses Income before Interest and Taxes 7 Interest expense Income before Taxes Income taxes Net Income 2005 $14,745 10,213 $4,532 $ 1,022 2,721 $3,743 $ 789 172 $ 617 123 494 $ 2. 2004 $12,908 8,761 $ 4,147 546 2,451 $2,997 $ 1,150 137 $ 1,013 355 $ 658 Les 8-34. a. Glenn Eddleman and Company Statement of Cash Flows For the Year Ended December 31, 2005 (in thousands) Cash Flows from Operating Activities: Net Income Adjustments to reconcile net income to net Depreciation expense Decrease in accounts receivable Increase in merchandise inventory Increase in prepaid expense Increase in accounts payable Net Cash Provided By Operating Activities Cash Flows from Investing Activities: Purchase of building Purchase of equipment Net Cash Used By Investing Activities Cash Flows from Financing Activities: Proceeds from long-term loan Proceeds from sale of common stock Payment of Short-Term Loan... Payment of Cash Dividends Net Cash Provided by Financing Activities Net Increase in Cash during 2005 Beginning Cash Balance, January 1, 2005 Ending Cash Balance, December 31, 2005 $184 150 (83) (40) 536 $(1,300) (300) $ 400 600 PARKASTE (200)2 (137) $ 494 747 $1,241 104T (1,600) 563 863 $ 304 1,936 $2,240 ☺) What Do You Think About Eddlemon From Above? 2) What Else Do You wont before making A Decision About Invessing? Liquidity Solvency Profitabilty Efficiency Current Quick Working Capital Debt Times Interest Earned Net Profit % Gross Profit % Earning per Share Return on Assets Return on Equity Asset Turnover Receivable Turnover Days to collect Inventory Turnover Days of Sales This Year 1.2800 1.0600 1220000 59.0800 4.5900 3.4000 30.7000 0.1830 5.0000 12.6000 1.4900 6.1056 59.7800 13.9047 26.2500 Last Year 1.3200 1.1100 1229000 62.0000 8.3900 5.1000 32.1000 0.2740 7.2000 19.7000 1.4200 5.1632 70.6900 12.5516 29.0800 Calculate This Year Ratio's and Last Year Ratio's and indicate any change, if any that should be made to the spreadsheet. Using the spreadsheet provided, do not make any changes 2. Compare and Comment (this year vs last year) 3. Compare and Comment (this year vs industry) Answer some simple questions 4. Would you extend a line of credit to this company? 5. If you were the bank, how would you feel? 6. Would you invest in this company? 7. Does the Manager deserve a Bonus December 31, 2005, and December 31, 2004 (in thousands) ASSETS Current Assets Cash Glenn Eddieman and Company Balance Sheets Accounts receivable Merchandise inventory Prepaid expenses Total Current Assets It and Equipment idings Less: Accumulated depreciation Buildings, net Equipment Less: Accumulated depreciation Equipment, net Total Plant and Equipment TOTAL ASSETS LIABILITIES AND STOCKHOLDERS' EQUITY Current Liabilities Accounts payable Notes payable Total Current Liabilities Long-Term Liabilities Total Liabilities Stockholders' Equity Common stock, / par value (3,, c 2005 (ained earnings fotal Stockholders' Equity' TOTAL LIABILITIES AND STOCKHOLDER'S EQUITY $2,240 24 2,340 < 776 200 $ 5,556 75 40 $1,616 53 2,720 < $ 4,336 $ 7,723 $6,423 3,534 3,677 $4,046 157 $2,889 $ 2,687 $2,387 1,564 1,523 $1,123 25 $ 864 $5,169 $10,725 2,000 400 $6,336 (out STAND 2,40;cu (04) $3,000 t 2004 (63) 1,389 357 4,389 $10,725 $1,936 2,490 693 160 $5,279 $3,753 $9,032 2003 1852 2510 503 160 4225 6423 340 3023 2387 1503 384 +3907 9232 820 $1,080 2,920 3080 $4,000 390 Juve. 1,600 $5,600 370 $2,400 24000 1,032 832 $3,432 3232 $9,032 9132 1 Glenn Eddleman and Company Income Statements For the Years Ended December 31, 2005, and December 31, 2004 (in thousands) Sales Revenue Cost of goods sold Gross Profit on Sales Operating Expenses Advertising and sales commissions General and administrative Total Expenses Income before Interest and Taxes 7 Interest expense Income before Taxes Income taxes Net Income 2005 $14,745 10,213 $4,532 $ 1,022 2,721 $3,743 $ 789 172 $ 617 123 494 $ 2. 2004 $12,908 8,761 $ 4,147 546 2,451 $2,997 $ 1,150 137 $ 1,013 355 $ 658 Les 8-34. a. Glenn Eddleman and Company Statement of Cash Flows For the Year Ended December 31, 2005 (in thousands) Cash Flows from Operating Activities: Net Income Adjustments to reconcile net income to net Depreciation expense Decrease in accounts receivable Increase in merchandise inventory Increase in prepaid expense Increase in accounts payable Net Cash Provided By Operating Activities Cash Flows from Investing Activities: Purchase of building Purchase of equipment Net Cash Used By Investing Activities Cash Flows from Financing Activities: Proceeds from long-term loan Proceeds from sale of common stock Payment of Short-Term Loan... Payment of Cash Dividends Net Cash Provided by Financing Activities Net Increase in Cash during 2005 Beginning Cash Balance, January 1, 2005 Ending Cash Balance, December 31, 2005 $184 150 (83) (40) 536 $(1,300) (300) $ 400 600 PARKASTE (200)2 (137) $ 494 747 $1,241 104T (1,600) 563 863 $ 304 1,936 $2,240 ☺) What Do You Think About Eddlemon From Above? 2) What Else Do You wont before making A Decision About Invessing? Liquidity Solvency Profitabilty Efficiency Current Quick Working Capital Debt Times Interest Earned Net Profit % Gross Profit % Earning per Share Return on Assets Return on Equity Asset Turnover Receivable Turnover Days to collect Inventory Turnover Days of Sales This Year 1.2800 1.0600 1220000 59.0800 4.5900 3.4000 30.7000 0.1830 5.0000 12.6000 1.4900 6.1056 59.7800 13.9047 26.2500 Last Year 1.3200 1.1100 1229000 62.0000 8.3900 5.1000 32.1000 0.2740 7.2000 19.7000 1.4200 5.1632 70.6900 12.5516 29.0800 Calculate This Year Ratio's and Last Year Ratio's and indicate any change, if any that should be made to the spreadsheet. Using the spreadsheet provided, do not make any changes 2. Compare and Comment (this year vs last year) 3. Compare and Comment (this year vs industry) Answer some simple questions 4. Would you extend a line of credit to this company? 5. If you were the bank, how would you feel? 6. Would you invest in this company? 7. Does the Manager deserve a Bonus December 31, 2005, and December 31, 2004 (in thousands) ASSETS Current Assets Cash Glenn Eddieman and Company Balance Sheets Accounts receivable Merchandise inventory Prepaid expenses Total Current Assets It and Equipment idings Less: Accumulated depreciation Buildings, net Equipment Less: Accumulated depreciation Equipment, net Total Plant and Equipment TOTAL ASSETS LIABILITIES AND STOCKHOLDERS' EQUITY Current Liabilities Accounts payable Notes payable Total Current Liabilities Long-Term Liabilities Total Liabilities Stockholders' Equity Common stock, / par value (3,, c 2005 (ained earnings fotal Stockholders' Equity' TOTAL LIABILITIES AND STOCKHOLDER'S EQUITY $2,240 24 2,340 < 776 200 $ 5,556 75 40 $1,616 53 2,720 < $ 4,336 $ 7,723 $6,423 3,534 3,677 $4,046 157 $2,889 $ 2,687 $2,387 1,564 1,523 $1,123 25 $ 864 $5,169 $10,725 2,000 400 $6,336 (out STAND 2,40;cu (04) $3,000 t 2004 (63) 1,389 357 4,389 $10,725 $1,936 2,490 693 160 $5,279 $3,753 $9,032 2003 1852 2510 503 160 4225 6423 340 3023 2387 1503 384 +3907 9232 820 $1,080 2,920 3080 $4,000 390 Juve. 1,600 $5,600 370 $2,400 24000 1,032 832 $3,432 3232 $9,032 9132 1 Glenn Eddleman and Company Income Statements For the Years Ended December 31, 2005, and December 31, 2004 (in thousands) Sales Revenue Cost of goods sold Gross Profit on Sales Operating Expenses Advertising and sales commissions General and administrative Total Expenses Income before Interest and Taxes 7 Interest expense Income before Taxes Income taxes Net Income 2005 $14,745 10,213 $4,532 $ 1,022 2,721 $3,743 $ 789 172 $ 617 123 494 $ 2. 2004 $12,908 8,761 $ 4,147 546 2,451 $2,997 $ 1,150 137 $ 1,013 355 $ 658 Les 8-34. a. Glenn Eddleman and Company Statement of Cash Flows For the Year Ended December 31, 2005 (in thousands) Cash Flows from Operating Activities: Net Income Adjustments to reconcile net income to net Depreciation expense Decrease in accounts receivable Increase in merchandise inventory Increase in prepaid expense Increase in accounts payable Net Cash Provided By Operating Activities Cash Flows from Investing Activities: Purchase of building Purchase of equipment Net Cash Used By Investing Activities Cash Flows from Financing Activities: Proceeds from long-term loan Proceeds from sale of common stock Payment of Short-Term Loan... Payment of Cash Dividends Net Cash Provided by Financing Activities Net Increase in Cash during 2005 Beginning Cash Balance, January 1, 2005 Ending Cash Balance, December 31, 2005 $184 150 (83) (40) 536 $(1,300) (300) $ 400 600 PARKASTE (200)2 (137) $ 494 747 $1,241 104T (1,600) 563 863 $ 304 1,936 $2,240 ☺) What Do You Think About Eddlemon From Above? 2) What Else Do You wont before making A Decision About Invessing? Liquidity Solvency Profitabilty Efficiency Current Quick Working Capital Debt Times Interest Earned Net Profit % Gross Profit % Earning per Share Return on Assets Return on Equity Asset Turnover Receivable Turnover Days to collect Inventory Turnover Days of Sales This Year 1.2800 1.0600 1220000 59.0800 4.5900 3.4000 30.7000 0.1830 5.0000 12.6000 1.4900 6.1056 59.7800 13.9047 26.2500 Last Year 1.3200 1.1100 1229000 62.0000 8.3900 5.1000 32.1000 0.2740 7.2000 19.7000 1.4200 5.1632 70.6900 12.5516 29.0800 Calculate This Year Ratio's and Last Year Ratio's and indicate any change, if any that should be made to the spreadsheet. Using the spreadsheet provided, do not make any changes 2. Compare and Comment (this year vs last year) 3. Compare and Comment (this year vs industry) Answer some simple questions 4. Would you extend a line of credit to this company? 5. If you were the bank, how would you feel? 6. Would you invest in this company? 7. Does the Manager deserve a Bonus December 31, 2005, and December 31, 2004 (in thousands) ASSETS Current Assets Cash Glenn Eddieman and Company Balance Sheets Accounts receivable Merchandise inventory Prepaid expenses Total Current Assets It and Equipment idings Less: Accumulated depreciation Buildings, net Equipment Less: Accumulated depreciation Equipment, net Total Plant and Equipment TOTAL ASSETS LIABILITIES AND STOCKHOLDERS' EQUITY Current Liabilities Accounts payable Notes payable Total Current Liabilities Long-Term Liabilities Total Liabilities Stockholders' Equity Common stock, / par value (3,, c 2005 (ained earnings fotal Stockholders' Equity' TOTAL LIABILITIES AND STOCKHOLDER'S EQUITY $2,240 24 2,340 < 776 200 $ 5,556 75 40 $1,616 53 2,720 < $ 4,336 $ 7,723 $6,423 3,534 3,677 $4,046 157 $2,889 $ 2,687 $2,387 1,564 1,523 $1,123 25 $ 864 $5,169 $10,725 2,000 400 $6,336 (out STAND 2,40;cu (04) $3,000 t 2004 (63) 1,389 357 4,389 $10,725 $1,936 2,490 693 160 $5,279 $3,753 $9,032 2003 1852 2510 503 160 4225 6423 340 3023 2387 1503 384 +3907 9232 820 $1,080 2,920 3080 $4,000 390 Juve. 1,600 $5,600 370 $2,400 24000 1,032 832 $3,432 3232 $9,032 9132 1 Glenn Eddleman and Company Income Statements For the Years Ended December 31, 2005, and December 31, 2004 (in thousands) Sales Revenue Cost of goods sold Gross Profit on Sales Operating Expenses Advertising and sales commissions General and administrative Total Expenses Income before Interest and Taxes 7 Interest expense Income before Taxes Income taxes Net Income 2005 $14,745 10,213 $4,532 $ 1,022 2,721 $3,743 $ 789 172 $ 617 123 494 $ 2. 2004 $12,908 8,761 $ 4,147 546 2,451 $2,997 $ 1,150 137 $ 1,013 355 $ 658 Les 8-34. a. Glenn Eddleman and Company Statement of Cash Flows For the Year Ended December 31, 2005 (in thousands) Cash Flows from Operating Activities: Net Income Adjustments to reconcile net income to net Depreciation expense Decrease in accounts receivable Increase in merchandise inventory Increase in prepaid expense Increase in accounts payable Net Cash Provided By Operating Activities Cash Flows from Investing Activities: Purchase of building Purchase of equipment Net Cash Used By Investing Activities Cash Flows from Financing Activities: Proceeds from long-term loan Proceeds from sale of common stock Payment of Short-Term Loan... Payment of Cash Dividends Net Cash Provided by Financing Activities Net Increase in Cash during 2005 Beginning Cash Balance, January 1, 2005 Ending Cash Balance, December 31, 2005 $184 150 (83) (40) 536 $(1,300) (300) $ 400 600 PARKASTE (200)2 (137) $ 494 747 $1,241 104T (1,600) 563 863 $ 304 1,936 $2,240 ☺) What Do You Think About Eddlemon From Above? 2) What Else Do You wont before making A Decision About Invessing? Liquidity Solvency Profitabilty Efficiency Current Quick Working Capital Debt Times Interest Earned Net Profit % Gross Profit % Earning per Share Return on Assets Return on Equity Asset Turnover Receivable Turnover Days to collect Inventory Turnover Days of Sales This Year 1.2800 1.0600 1220000 59.0800 4.5900 3.4000 30.7000 0.1830 5.0000 12.6000 1.4900 6.1056 59.7800 13.9047 26.2500 Last Year 1.3200 1.1100 1229000 62.0000 8.3900 5.1000 32.1000 0.2740 7.2000 19.7000 1.4200 5.1632 70.6900 12.5516 29.0800 Calculate This Year Ratio's and Last Year Ratio's and indicate any change, if any that should be made to the spreadsheet. Using the spreadsheet provided, do not make any changes 2. Compare and Comment (this year vs last year) 3. Compare and Comment (this year vs industry) Answer some simple questions 4. Would you extend a line of credit to this company? 5. If you were the bank, how would you feel? 6. Would you invest in this company? 7. Does the Manager deserve a Bonus December 31, 2005, and December 31, 2004 (in thousands) ASSETS Current Assets Cash Glenn Eddieman and Company Balance Sheets Accounts receivable Merchandise inventory Prepaid expenses Total Current Assets It and Equipment idings Less: Accumulated depreciation Buildings, net Equipment Less: Accumulated depreciation Equipment, net Total Plant and Equipment TOTAL ASSETS LIABILITIES AND STOCKHOLDERS' EQUITY Current Liabilities Accounts payable Notes payable Total Current Liabilities Long-Term Liabilities Total Liabilities Stockholders' Equity Common stock, / par value (3,, c 2005 (ained earnings fotal Stockholders' Equity' TOTAL LIABILITIES AND STOCKHOLDER'S EQUITY $2,240 24 2,340 < 776 200 $ 5,556 75 40 $1,616 53 2,720 < $ 4,336 $ 7,723 $6,423 3,534 3,677 $4,046 157 $2,889 $ 2,687 $2,387 1,564 1,523 $1,123 25 $ 864 $5,169 $10,725 2,000 400 $6,336 (out STAND 2,40;cu (04) $3,000 t 2004 (63) 1,389 357 4,389 $10,725 $1,936 2,490 693 160 $5,279 $3,753 $9,032 2003 1852 2510 503 160 4225 6423 340 3023 2387 1503 384 +3907 9232 820 $1,080 2,920 3080 $4,000 390 Juve. 1,600 $5,600 370 $2,400 24000 1,032 832 $3,432 3232 $9,032 9132 1 Glenn Eddleman and Company Income Statements For the Years Ended December 31, 2005, and December 31, 2004 (in thousands) Sales Revenue Cost of goods sold Gross Profit on Sales Operating Expenses Advertising and sales commissions General and administrative Total Expenses Income before Interest and Taxes 7 Interest expense Income before Taxes Income taxes Net Income 2005 $14,745 10,213 $4,532 $ 1,022 2,721 $3,743 $ 789 172 $ 617 123 494 $ 2. 2004 $12,908 8,761 $ 4,147 546 2,451 $2,997 $ 1,150 137 $ 1,013 355 $ 658 Les 8-34. a. Glenn Eddleman and Company Statement of Cash Flows For the Year Ended December 31, 2005 (in thousands) Cash Flows from Operating Activities: Net Income Adjustments to reconcile net income to net Depreciation expense Decrease in accounts receivable Increase in merchandise inventory Increase in prepaid expense Increase in accounts payable Net Cash Provided By Operating Activities Cash Flows from Investing Activities: Purchase of building Purchase of equipment Net Cash Used By Investing Activities Cash Flows from Financing Activities: Proceeds from long-term loan Proceeds from sale of common stock Payment of Short-Term Loan... Payment of Cash Dividends Net Cash Provided by Financing Activities Net Increase in Cash during 2005 Beginning Cash Balance, January 1, 2005 Ending Cash Balance, December 31, 2005 $184 150 (83) (40) 536 $(1,300) (300) $ 400 600 PARKASTE (200)2 (137) $ 494 747 $1,241 104T (1,600) 563 863 $ 304 1,936 $2,240 ☺) What Do You Think About Eddlemon From Above? 2) What Else Do You wont before making A Decision About Invessing? Liquidity Solvency Profitabilty Efficiency Current Quick Working Capital Debt Times Interest Earned Net Profit % Gross Profit % Earning per Share Return on Assets Return on Equity Asset Turnover Receivable Turnover Days to collect Inventory Turnover Days of Sales This Year 1.2800 1.0600 1220000 59.0800 4.5900 3.4000 30.7000 0.1830 5.0000 12.6000 1.4900 6.1056 59.7800 13.9047 26.2500 Last Year 1.3200 1.1100 1229000 62.0000 8.3900 5.1000 32.1000 0.2740 7.2000 19.7000 1.4200 5.1632 70.6900 12.5516 29.0800 Calculate This Year Ratio's and Last Year Ratio's and indicate any change, if any that should be made to the spreadsheet. Using the spreadsheet provided, do not make any changes 2. Compare and Comment (this year vs last year) 3. Compare and Comment (this year vs industry) Answer some simple questions 4. Would you extend a line of credit to this company? 5. If you were the bank, how would you feel? 6. Would you invest in this company? 7. Does the Manager deserve a Bonus December 31, 2005, and December 31, 2004 (in thousands) ASSETS Current Assets Cash Glenn Eddieman and Company Balance Sheets Accounts receivable Merchandise inventory Prepaid expenses Total Current Assets It and Equipment idings Less: Accumulated depreciation Buildings, net Equipment Less: Accumulated depreciation Equipment, net Total Plant and Equipment TOTAL ASSETS LIABILITIES AND STOCKHOLDERS' EQUITY Current Liabilities Accounts payable Notes payable Total Current Liabilities Long-Term Liabilities Total Liabilities Stockholders' Equity Common stock, / par value (3,, c 2005 (ained earnings fotal Stockholders' Equity' TOTAL LIABILITIES AND STOCKHOLDER'S EQUITY $2,240 24 2,340 < 776 200 $ 5,556 75 40 $1,616 53 2,720 < $ 4,336 $ 7,723 $6,423 3,534 3,677 $4,046 157 $2,889 $ 2,687 $2,387 1,564 1,523 $1,123 25 $ 864 $5,169 $10,725 2,000 400 $6,336 (out STAND 2,40;cu (04) $3,000 t 2004 (63) 1,389 357 4,389 $10,725 $1,936 2,490 693 160 $5,279 $3,753 $9,032 2003 1852 2510 503 160 4225 6423 340 3023 2387 1503 384 +3907 9232 820 $1,080 2,920 3080 $4,000 390 Juve. 1,600 $5,600 370 $2,400 24000 1,032 832 $3,432 3232 $9,032 9132 1 Glenn Eddleman and Company Income Statements For the Years Ended December 31, 2005, and December 31, 2004 (in thousands) Sales Revenue Cost of goods sold Gross Profit on Sales Operating Expenses Advertising and sales commissions General and administrative Total Expenses Income before Interest and Taxes 7 Interest expense Income before Taxes Income taxes Net Income 2005 $14,745 10,213 $4,532 $ 1,022 2,721 $3,743 $ 789 172 $ 617 123 494 $ 2. 2004 $12,908 8,761 $ 4,147 546 2,451 $2,997 $ 1,150 137 $ 1,013 355 $ 658 Les 8-34. a. Glenn Eddleman and Company Statement of Cash Flows For the Year Ended December 31, 2005 (in thousands) Cash Flows from Operating Activities: Net Income Adjustments to reconcile net income to net Depreciation expense Decrease in accounts receivable Increase in merchandise inventory Increase in prepaid expense Increase in accounts payable Net Cash Provided By Operating Activities Cash Flows from Investing Activities: Purchase of building Purchase of equipment Net Cash Used By Investing Activities Cash Flows from Financing Activities: Proceeds from long-term loan Proceeds from sale of common stock Payment of Short-Term Loan... Payment of Cash Dividends Net Cash Provided by Financing Activities Net Increase in Cash during 2005 Beginning Cash Balance, January 1, 2005 Ending Cash Balance, December 31, 2005 $184 150 (83) (40) 536 $(1,300) (300) $ 400 600 PARKASTE (200)2 (137) $ 494 747 $1,241 104T (1,600) 563 863 $ 304 1,936 $2,240 ☺) What Do You Think About Eddlemon From Above? 2) What Else Do You wont before making A Decision About Invessing? Liquidity Solvency Profitabilty Efficiency Current Quick Working Capital Debt Times Interest Earned Net Profit % Gross Profit % Earning per Share Return on Assets Return on Equity Asset Turnover Receivable Turnover Days to collect Inventory Turnover Days of Sales This Year 1.2800 1.0600 1220000 59.0800 4.5900 3.4000 30.7000 0.1830 5.0000 12.6000 1.4900 6.1056 59.7800 13.9047 26.2500 Last Year 1.3200 1.1100 1229000 62.0000 8.3900 5.1000 32.1000 0.2740 7.2000 19.7000 1.4200 5.1632 70.6900 12.5516 29.0800 Calculate This Year Ratio's and Last Year Ratio's and indicate any change, if any that should be made to the spreadsheet. Using the spreadsheet provided, do not make any changes 2. Compare and Comment (this year vs last year) 3. Compare and Comment (this year vs industry) Answer some simple questions 4. Would you extend a line of credit to this company? 5. If you were the bank, how would you feel? 6. Would you invest in this company? 7. Does the Manager deserve a Bonus December 31, 2005, and December 31, 2004 (in thousands) ASSETS Current Assets Cash Glenn Eddieman and Company Balance Sheets Accounts receivable Merchandise inventory Prepaid expenses Total Current Assets It and Equipment idings Less: Accumulated depreciation Buildings, net Equipment Less: Accumulated depreciation Equipment, net Total Plant and Equipment TOTAL ASSETS LIABILITIES AND STOCKHOLDERS' EQUITY Current Liabilities Accounts payable Notes payable Total Current Liabilities Long-Term Liabilities Total Liabilities Stockholders' Equity Common stock, / par value (3,, c 2005 (ained earnings fotal Stockholders' Equity' TOTAL LIABILITIES AND STOCKHOLDER'S EQUITY $2,240 24 2,340 < 776 200 $ 5,556 75 40 $1,616 53 2,720 < $ 4,336 $ 7,723 $6,423 3,534 3,677 $4,046 157 $2,889 $ 2,687 $2,387 1,564 1,523 $1,123 25 $ 864 $5,169 $10,725 2,000 400 $6,336 (out STAND 2,40;cu (04) $3,000 t 2004 (63) 1,389 357 4,389 $10,725 $1,936 2,490 693 160 $5,279 $3,753 $9,032 2003 1852 2510 503 160 4225 6423 340 3023 2387 1503 384 +3907 9232 820 $1,080 2,920 3080 $4,000 390 Juve. 1,600 $5,600 370 $2,400 24000 1,032 832 $3,432 3232 $9,032 9132 1 Glenn Eddleman and Company Income Statements For the Years Ended December 31, 2005, and December 31, 2004 (in thousands) Sales Revenue Cost of goods sold Gross Profit on Sales Operating Expenses Advertising and sales commissions General and administrative Total Expenses Income before Interest and Taxes 7 Interest expense Income before Taxes Income taxes Net Income 2005 $14,745 10,213 $4,532 $ 1,022 2,721 $3,743 $ 789 172 $ 617 123 494 $ 2. 2004 $12,908 8,761 $ 4,147 546 2,451 $2,997 $ 1,150 137 $ 1,013 355 $ 658 Les 8-34. a. Glenn Eddleman and Company Statement of Cash Flows For the Year Ended December 31, 2005 (in thousands) Cash Flows from Operating Activities: Net Income Adjustments to reconcile net income to net Depreciation expense Decrease in accounts receivable Increase in merchandise inventory Increase in prepaid expense Increase in accounts payable Net Cash Provided By Operating Activities Cash Flows from Investing Activities: Purchase of building Purchase of equipment Net Cash Used By Investing Activities Cash Flows from Financing Activities: Proceeds from long-term loan Proceeds from sale of common stock Payment of Short-Term Loan... Payment of Cash Dividends Net Cash Provided by Financing Activities Net Increase in Cash during 2005 Beginning Cash Balance, January 1, 2005 Ending Cash Balance, December 31, 2005 $184 150 (83) (40) 536 $(1,300) (300) $ 400 600 PARKASTE (200)2 (137) $ 494 747 $1,241 104T (1,600) 563 863 $ 304 1,936 $2,240 ☺) What Do You Think About Eddlemon From Above? 2) What Else Do You wont before making A Decision About Invessing? Liquidity Solvency Profitabilty Efficiency Current Quick Working Capital Debt Times Interest Earned Net Profit % Gross Profit % Earning per Share Return on Assets Return on Equity Asset Turnover Receivable Turnover Days to collect Inventory Turnover Days of Sales This Year 1.2800 1.0600 1220000 59.0800 4.5900 3.4000 30.7000 0.1830 5.0000 12.6000 1.4900 6.1056 59.7800 13.9047 26.2500 Last Year 1.3200 1.1100 1229000 62.0000 8.3900 5.1000 32.1000 0.2740 7.2000 19.7000 1.4200 5.1632 70.6900 12.5516 29.0800 Calculate This Year Ratio's and Last Year Ratio's and indicate any change, if any that should be made to the spreadsheet. Using the spreadsheet provided, do not make any changes 2. Compare and Comment (this year vs last year) 3. Compare and Comment (this year vs industry) Answer some simple questions 4. Would you extend a line of credit to this company? 5. If you were the bank, how would you feel? 6. Would you invest in this company? 7. Does the Manager deserve a Bonus December 31, 2005, and December 31, 2004 (in thousands) ASSETS Current Assets Cash Glenn Eddieman and Company Balance Sheets Accounts receivable Merchandise inventory Prepaid expenses Total Current Assets It and Equipment idings Less: Accumulated depreciation Buildings, net Equipment Less: Accumulated depreciation Equipment, net Total Plant and Equipment TOTAL ASSETS LIABILITIES AND STOCKHOLDERS' EQUITY Current Liabilities Accounts payable Notes payable Total Current Liabilities Long-Term Liabilities Total Liabilities Stockholders' Equity Common stock, / par value (3,, c 2005 (ained earnings fotal Stockholders' Equity' TOTAL LIABILITIES AND STOCKHOLDER'S EQUITY $2,240 24 2,340 < 776 200 $ 5,556 75 40 $1,616 53 2,720 < $ 4,336 $ 7,723 $6,423 3,534 3,677 $4,046 157 $2,889 $ 2,687 $2,387 1,564 1,523 $1,123 25 $ 864 $5,169 $10,725 2,000 400 $6,336 (out STAND 2,40;cu (04) $3,000 t 2004 (63) 1,389 357 4,389 $10,725 $1,936 2,490 693 160 $5,279 $3,753 $9,032 2003 1852 2510 503 160 4225 6423 340 3023 2387 1503 384 +3907 9232 820 $1,080 2,920 3080 $4,000 390 Juve. 1,600 $5,600 370 $2,400 24000 1,032 832 $3,432 3232 $9,032 9132 1 Glenn Eddleman and Company Income Statements For the Years Ended December 31, 2005, and December 31, 2004 (in thousands) Sales Revenue Cost of goods sold Gross Profit on Sales Operating Expenses Advertising and sales commissions General and administrative Total Expenses Income before Interest and Taxes 7 Interest expense Income before Taxes Income taxes Net Income 2005 $14,745 10,213 $4,532 $ 1,022 2,721 $3,743 $ 789 172 $ 617 123 494 $ 2. 2004 $12,908 8,761 $ 4,147 546 2,451 $2,997 $ 1,150 137 $ 1,013 355 $ 658 Les 8-34. a. Glenn Eddleman and Company Statement of Cash Flows For the Year Ended December 31, 2005 (in thousands) Cash Flows from Operating Activities: Net Income Adjustments to reconcile net income to net Depreciation expense Decrease in accounts receivable Increase in merchandise inventory Increase in prepaid expense Increase in accounts payable Net Cash Provided By Operating Activities Cash Flows from Investing Activities: Purchase of building Purchase of equipment Net Cash Used By Investing Activities Cash Flows from Financing Activities: Proceeds from long-term loan Proceeds from sale of common stock Payment of Short-Term Loan... Payment of Cash Dividends Net Cash Provided by Financing Activities Net Increase in Cash during 2005 Beginning Cash Balance, January 1, 2005 Ending Cash Balance, December 31, 2005 $184 150 (83) (40) 536 $(1,300) (300) $ 400 600 PARKASTE (200)2 (137) $ 494 747 $1,241 104T (1,600) 563 863 $ 304 1,936 $2,240 ☺) What Do You Think About Eddlemon From Above? 2) What Else Do You wont before making A Decision About Invessing? Liquidity Solvency Profitabilty Efficiency Current Quick Working Capital Debt Times Interest Earned Net Profit % Gross Profit % Earning per Share Return on Assets Return on Equity Asset Turnover Receivable Turnover Days to collect Inventory Turnover Days of Sales This Year 1.2800 1.0600 1220000 59.0800 4.5900 3.4000 30.7000 0.1830 5.0000 12.6000 1.4900 6.1056 59.7800 13.9047 26.2500 Last Year 1.3200 1.1100 1229000 62.0000 8.3900 5.1000 32.1000 0.2740 7.2000 19.7000 1.4200 5.1632 70.6900 12.5516 29.0800 Calculate This Year Ratio's and Last Year Ratio's and indicate any change, if any that should be made to the spreadsheet. Using the spreadsheet provided, do not make any changes 2. Compare and Comment (this year vs last year) 3. Compare and Comment (this year vs industry) Answer some simple questions 4. Would you extend a line of credit to this company? 5. If you were the bank, how would you feel? 6. Would you invest in this company? 7. Does the Manager deserve a Bonus December 31, 2005, and December 31, 2004 (in thousands) ASSETS Current Assets Cash Glenn Eddieman and Company Balance Sheets Accounts receivable Merchandise inventory Prepaid expenses Total Current Assets It and Equipment idings Less: Accumulated depreciation Buildings, net Equipment Less: Accumulated depreciation Equipment, net Total Plant and Equipment TOTAL ASSETS LIABILITIES AND STOCKHOLDERS' EQUITY Current Liabilities Accounts payable Notes payable Total Current Liabilities Long-Term Liabilities Total Liabilities Stockholders' Equity Common stock, / par value (3,, c 2005 (ained earnings fotal Stockholders' Equity' TOTAL LIABILITIES AND STOCKHOLDER'S EQUITY $2,240 24 2,340 < 776 200 $ 5,556 75 40 $1,616 53 2,720 < $ 4,336 $ 7,723 $6,423 3,534 3,677 $4,046 157 $2,889 $ 2,687 $2,387 1,564 1,523 $1,123 25 $ 864 $5,169 $10,725 2,000 400 $6,336 (out STAND 2,40;cu (04) $3,000 t 2004 (63) 1,389 357 4,389 $10,725 $1,936 2,490 693 160 $5,279 $3,753 $9,032 2003 1852 2510 503 160 4225 6423 340 3023 2387 1503 384 +3907 9232 820 $1,080 2,920 3080 $4,000 390 Juve. 1,600 $5,600 370 $2,400 24000 1,032 832 $3,432 3232 $9,032 9132 1 Glenn Eddleman and Company Income Statements For the Years Ended December 31, 2005, and December 31, 2004 (in thousands) Sales Revenue Cost of goods sold Gross Profit on Sales Operating Expenses Advertising and sales commissions General and administrative Total Expenses Income before Interest and Taxes 7 Interest expense Income before Taxes Income taxes Net Income 2005 $14,745 10,213 $4,532 $ 1,022 2,721 $3,743 $ 789 172 $ 617 123 494 $ 2. 2004 $12,908 8,761 $ 4,147 546 2,451 $2,997 $ 1,150 137 $ 1,013 355 $ 658 Les 8-34. a. Glenn Eddleman and Company Statement of Cash Flows For the Year Ended December 31, 2005 (in thousands) Cash Flows from Operating Activities: Net Income Adjustments to reconcile net income to net Depreciation expense Decrease in accounts receivable Increase in merchandise inventory Increase in prepaid expense Increase in accounts payable Net Cash Provided By Operating Activities Cash Flows from Investing Activities: Purchase of building Purchase of equipment Net Cash Used By Investing Activities Cash Flows from Financing Activities: Proceeds from long-term loan Proceeds from sale of common stock Payment of Short-Term Loan... Payment of Cash Dividends Net Cash Provided by Financing Activities Net Increase in Cash during 2005 Beginning Cash Balance, January 1, 2005 Ending Cash Balance, December 31, 2005 $184 150 (83) (40) 536 $(1,300) (300) $ 400 600 PARKASTE (200)2 (137) $ 494 747 $1,241 104T (1,600) 563 863 $ 304 1,936 $2,240 ☺) What Do You Think About Eddlemon From Above? 2) What Else Do You wont before making A Decision About Invessing? Liquidity Solvency Profitabilty Efficiency Current Quick Working Capital Debt Times Interest Earned Net Profit % Gross Profit % Earning per Share Return on Assets Return on Equity Asset Turnover Receivable Turnover Days to collect Inventory Turnover Days of Sales This Year 1.2800 1.0600 1220000 59.0800 4.5900 3.4000 30.7000 0.1830 5.0000 12.6000 1.4900 6.1056 59.7800 13.9047 26.2500 Last Year 1.3200 1.1100 1229000 62.0000 8.3900 5.1000 32.1000 0.2740 7.2000 19.7000 1.4200 5.1632 70.6900 12.5516 29.0800
Expert Answer:
Answer rating: 100% (QA)
1 Based on the ratios calculated it appears that the company is doing slightly worse this year compared to last year The current ratio and quick ratio ... View the full answer

Related Book For 
Auditing and Assurance Services A Systematic Approach
ISBN: 978-1259162343
9th edition
Authors: William Messier, Steven Glover, Douglas Prawitt
Posted Date:
Students also viewed these accounting questions
-
After a rapid growth in its business during recent years, the Gilbert Lumber Company in the spring of 2014 anticipated a further substantial increase in sales. Despite good profits, the company had...
-
The Crazy Eddie fraud may appear smaller and gentler than the massive billion-dollar frauds exposed in recent times, such as Bernie Madoffs Ponzi scheme, frauds in the subprime mortgage market, the...
-
Broussard Skateboard's sales are expected to increase by 25% from $7.6 million in 2019 to $9.50 million in 2020. Its assets totaled $5 million at the end of 2019. Broussard is already at full...
-
If the demand during review cycle is equal to 12, the demand during lead time is 11, and the safety stock is equal to 8, what is the order point? What is the EOQ of an item with a project annual...
-
A representative of Gracious Living, Inc., called on the Hutchinsons and identified himself as a "demonstrator" of water-softening equipment. After explaining the cost of the equipment, he told the...
-
Hectors General Store advertises cans of Fancy brand whole tomatoes for fifty cents per can, although he does not have any in stock. When customers arrive to buy the tomatoes, Hector tells them that...
-
Derive the frequency equation for the longitudinal vibration of a stepped bar having two different cross-sectional areas \(A_{1}\) and \(A_{2}\) over lengths \(l_{1}\) and \(l_{2}\), respectively....
-
A new president at Big State University has made student satisfaction with the enrollment and registration process one of her highest priorities. Students must see an advisor, sign up for classes,...
-
Balance, September 1 Checks BANK STATEMENT Deposits Other Balance $ 1,940 September 7 NSF check $ 90 1,850 September 11 $ 2,910 4,760 September 12 #101 $ 770 3,990 September 17 #102 1,640 2,350...
-
White Ski Resorts operates a series of ski resorts in northern Europe and reports under IFRS. On June 30, 20X0, White purchased land for 3,000,000. White reports land values on the balance sheet...
-
Write down 3 possible strengths that will help secure success of the customer engagement journey and 3 weaknesses that may cause failure of the customer engagement journey.
-
Why are sukuk becoming an increasingly important source of financing for companies? Discuss.
-
If necessary, we will (review, change, reduce) overtime hours to (fix, balance, rework) the budget. From the choices in parentheses, select the most precise, vigorous words.
-
What approaches to budgeting can be used by organizations planning for social media marketing?
-
Which of the following statement(s) is (are) TRUE? I. Sukuk are debt obligations due from the issuer to the investors. II. Sukuk are trust certificates. III. Sale of sukuk is basically the sale of a...
-
Ranas outstanding report contains (a lot of, many, a warehouse of) helpful data. From the choices in parentheses, select the most precise, vigorous words.
-
Clay Corp. sold $500,000 of 8%, five-year bonds for $550,000. The purchasers were issued 2,000 detachable warrants, each of which was for one share of Clay's $5 par value common stock at $12 per...
-
Evaluate how many lines there are in a true rotational spectrum of CO molecules whose natural vibration frequency is w = 4.09 1014 s1 and moment of inertia I = 1.44 1039 g cm2.
-
Many companies post their financial statements and auditors report on their home pages, generally under a heading labeled investor relations. Use one of the Internet search engines to do the...
-
Distinguish between audit risk and engagement risk.
-
The following audit report was drafted by a junior staff accountant of Lipske & Griffin, CPAs, at the completion of the audit of Douglas Companys ICFR. The report was submitted to the engagement...
-
The shaft is supported by journal bearings at \(A\) and \(B\) that exert force components only in the \(x\) and \(z\) directions on the shaft. If the allowable normal stress for the shaft is...
-
The shaft is supported by bearings at \(A\) and \(B\) that exert force components only in the \(x\) and \(z\) directions on the shaft. If the allowable normal stress for the shaft is \(\sigma_{\text...
-
Determine the equivalent state of stress on an element if it is oriented \(50^{\circ}\) counterclockwise from the element shown. Use the stress transformation equations. 16 ksi 10 ksi

Study smarter with the SolutionInn App