

Question: Calculate XYZs 2013 current and quick ratios based on the projected balance sheet and income statement data below: Analysis of Financial Statements Balance Sheets EXHIBITS:
Calculate XYZs 2013 current and quick ratios based on the projected balance sheet and income statement data below:
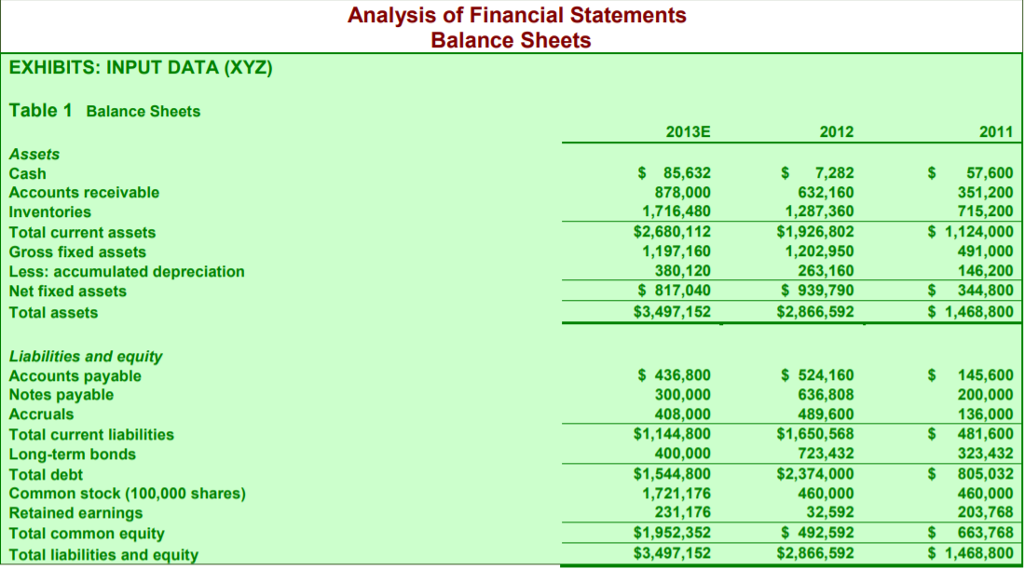
Analysis of Financial Statements Balance Sheets EXHIBITS: INPUT DATA (XYZ) Table 1 Balance Sheets 2013E 2012 2011 Assets Cash Accounts receivable Inventories Total current assets Gross fixed assets Less: accumulated depreciation Net fixed assets Total assets $ 85,632 878,000 1,716,480 $2,680,112 1,197,160 380,120 $817,040 $3,497,152 $ 7,282 632,160 1,287,360 $1,926,802 1,202,950 263,160 939,790 $2,866,592 $ 57,600 351,200 715,200 $ 1,124,000 491,000 146,200 $ 344,800 $ 1,468,800 Liabilities and equity $ 436,800 300,000 408,000 $1,144,800 400,000 $1,544,800 1,721,176 231,176 $1,952,352 $3,497,152 $524,160 636,808 489,600 $1,650,568 723,432 $2,374,000 460,000 32,592 $ 492,592 $2,866,592 $ 145,600 200,000 136,000 $ 481,600 323,432 $ 805,032 460,000 203,768 $ 663,768 $1,468,800 Accounts payable Notes payable Accruals Total current liabilities Long-term bonds Total debt Common stock (100,000 shares) Retained earnings Total common equity Total liabilities and equit
Step by Step Solution
There are 3 Steps involved in it

Get step-by-step solutions from verified subject matter experts