

Question: ( Calculating call option payouts ) Currently, a call contract with an exercise price of $ 1 0 on a share of List Aerospace's common
Calculating call option payouts Currently, a call contract with an exercise price of $ on a share of
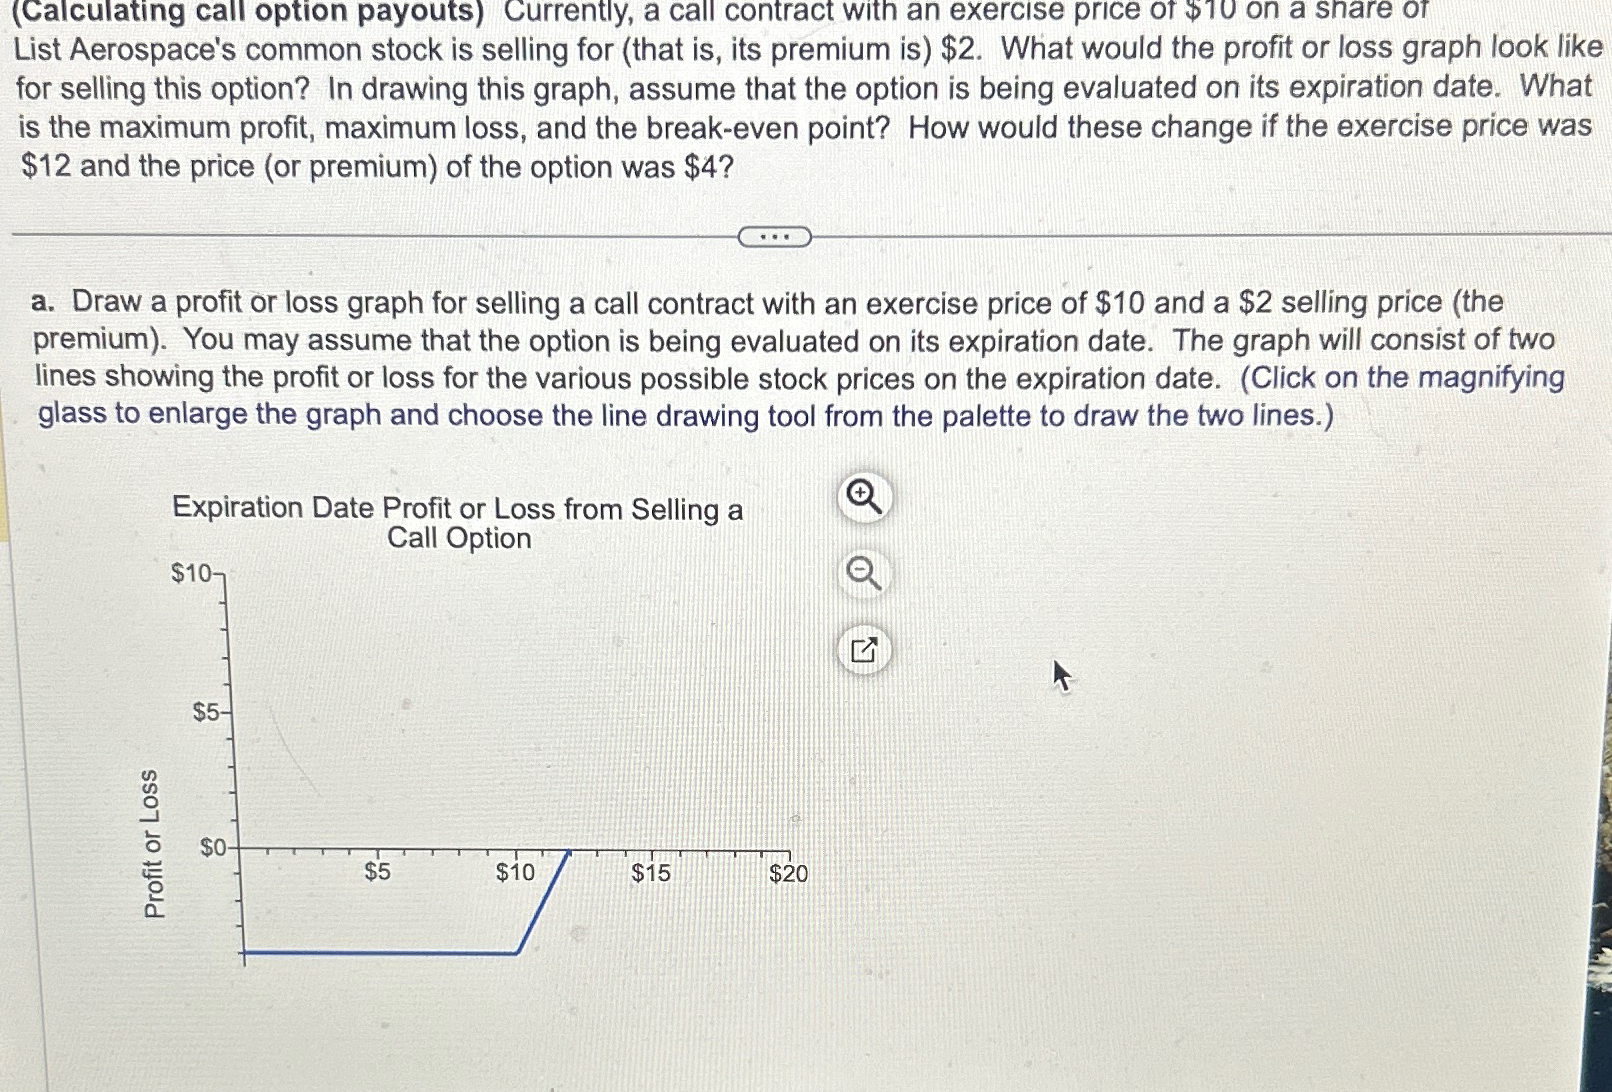
List Aerospace's common stock is selling for that is its premium is $ What would the profit or loss graph look like for selling this option? In drawing this graph, assume that the option is being evaluated on its expiration date. What is the maximum profit, maximum loss, and the breakeven point? How would these change if the exercise price was $ and the price or premium of the option was $
a Draw a profit or loss graph for selling a call contract with an exercise price of $ and a $ selling price the premium You may assume that the option is being evaluated on its expiration date. The graph will consist of two lines showing the profit or loss for the various possible stock prices on the expiration date. Click on the magnifying glass to enlarge the graph and choose the line drawing tool from the palette to draw the two lines.
Step by Step Solution
There are 3 Steps involved in it
1 Expert Approved Answer
Step: 1 Unlock

Question Has Been Solved by an Expert!
Get step-by-step solutions from verified subject matter experts
Step: 2 Unlock
Step: 3 Unlock