

Question: Calculating Productivity and Production. ( 3 2 . 5 % ) You are managing a fairly complicated production process of digital readers, and you are
Calculating Productivity and Production. You are managing a fairly complicated production
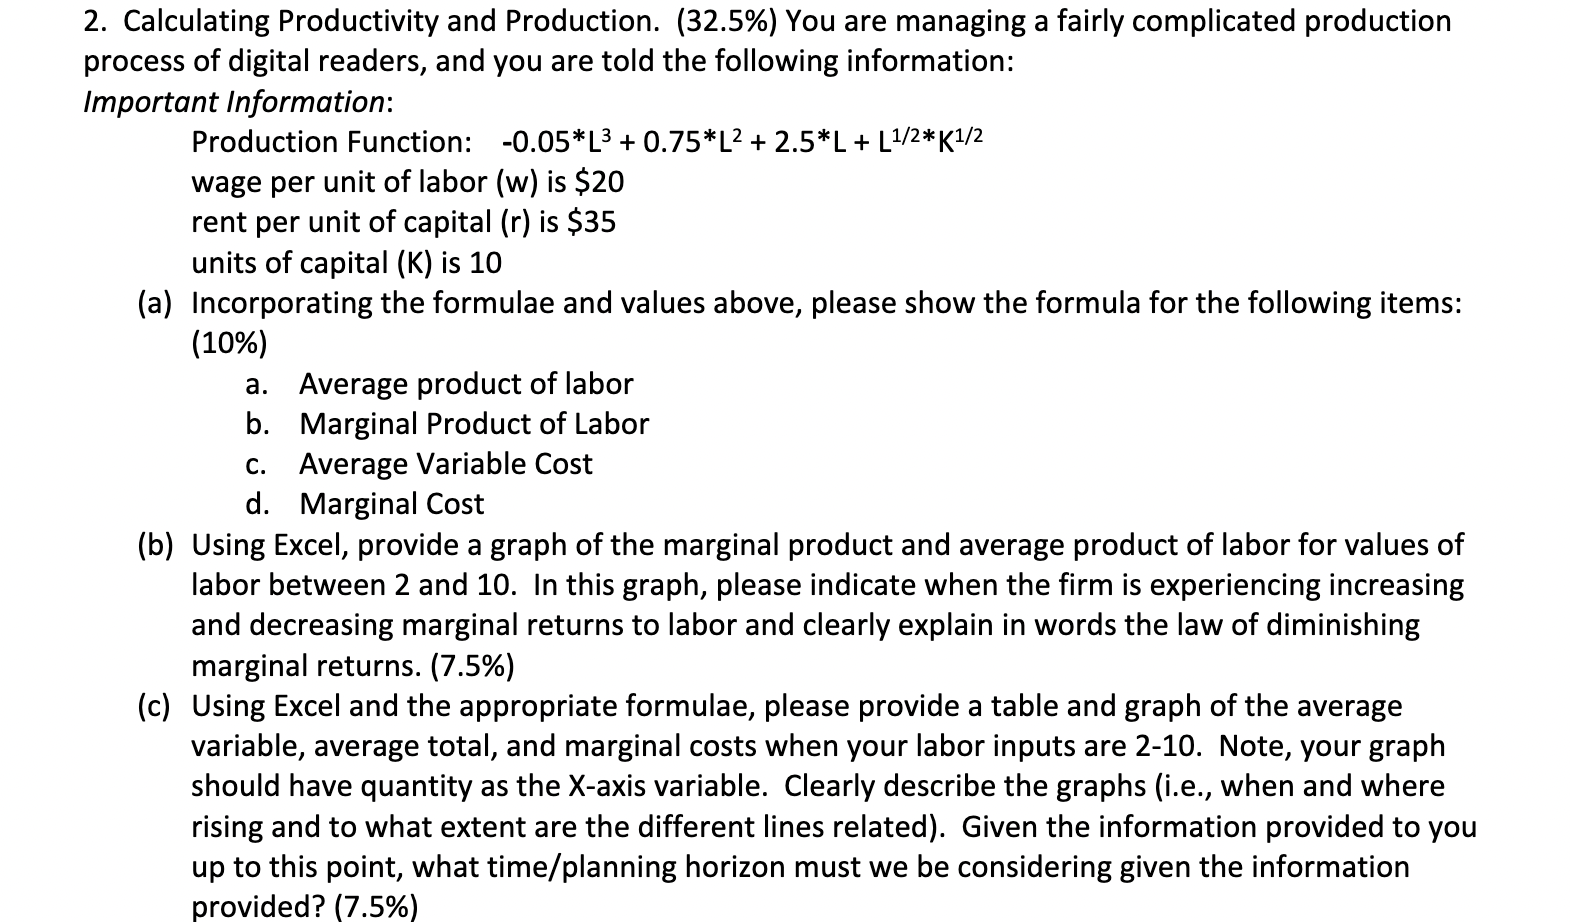
process of digital readers, and you are told the following information:
Important Information:
Production Function:
wage per unit of labor is $
rent per unit of capital is $
units of capital is
a Incorporating the formulae and values above, please show the formula for the following items:
a Average product of labor
b Marginal Product of Labor
c Average Variable Cost
d Marginal Cost
b Using Excel, provide a graph of the marginal product and average product of labor for values of
labor between and In this graph, please indicate when the firm is experiencing increasing
and decreasing marginal returns to labor and clearly explain in words the law of diminishing
marginal returns.
c Using Excel and the appropriate formulae, please provide a table and graph of the average
variable, average total, and marginal costs when your labor inputs are Note, your graph
should have quantity as the Xaxis variable. Clearly describe the graphs ie when and where
rising and to what extent are the different lines related Given the information provided to you
up to this point, what timeplanning horizon must we be considering given the information
provided?
Step by Step Solution
There are 3 Steps involved in it
1 Expert Approved Answer
Step: 1 Unlock

Question Has Been Solved by an Expert!
Get step-by-step solutions from verified subject matter experts
Step: 2 Unlock
Step: 3 Unlock