

Question: Calculating ratios is only the first step in the analysis process, the ratios results need interpretation. 1. What do the results indicate about the financial
Calculating ratios is only the first step in the analysis process, the ratios results need interpretation.
1. What do the results indicate about the financial performance?
2. Consider how these values are changing. Interpret these changes as positive or negative for the corporation. What can be done to counteract negative trends, or continue with positive trends? What actions do you recommend management take?
3. Also, relate changes in revenues and cost of goods sold values to changes in accounts receivable and inventory from year to year. Do the changes in revenues and cost of goods sold agree with the changes in accounts receivable and inventory? (In 2018, cost of goods sold was 13,067 and total revenue was 31.86B. In 2019, cost of goods sold was 14,619 and total revenue was 37.27)
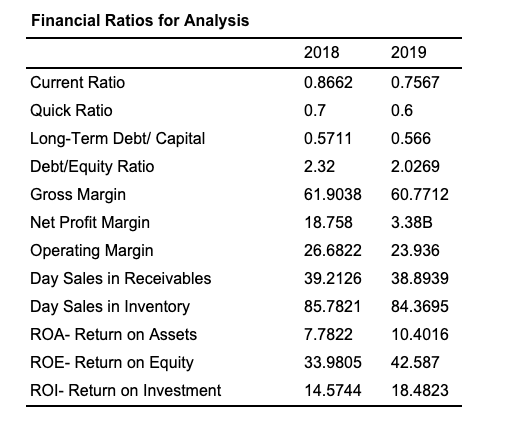
Financial Ratios for Analysis 2018 2019 Current Ratio 0.8662 0.7567 0.6 0.566 2.0269 60.7712 3.38B Quick Ratio Long-Term Debt/ Capital Debt/Equity Ratio Gross Margin Net Profit Margin Operating Margin Day Sales in Receivables Day Sales in Inventory ROA- Return on Assets ROE- Return on Equity ROI- Return on Investment 0.7 0.5711 2.32 61.9038 18.758 26.6822 39.2126 85.7821 7.7822 33.9805 23.936 38.8939 84.3695 10.4016 42.587 18.4823 14.5744
Step by Step Solution
There are 3 Steps involved in it

Get step-by-step solutions from verified subject matter experts