

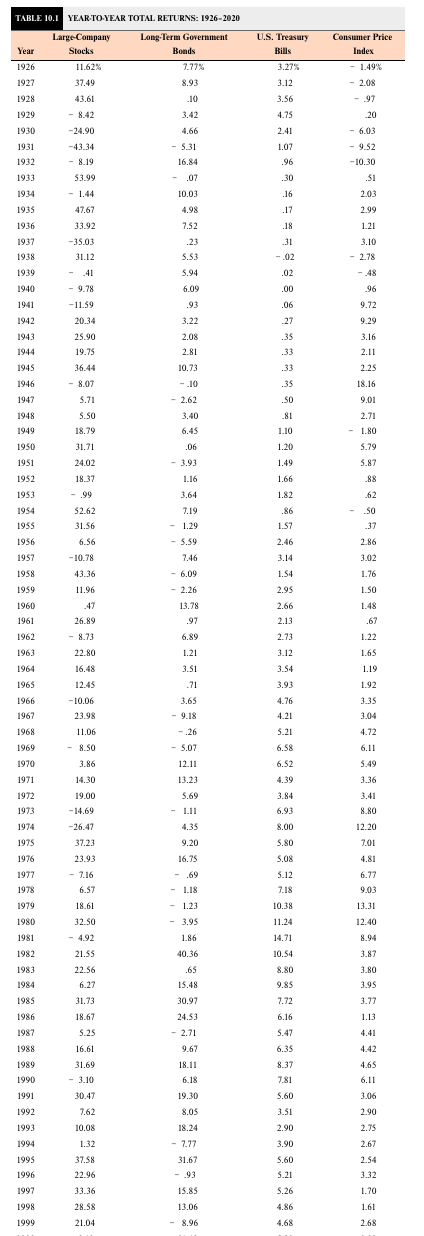
Question: Calculating Real Returns Refer to Table 10.1. What was the average real return for Treasury bills from 1926 through 1932? 2. Calculating Returns Refer to
- Calculating Real Returns Refer to Table 10.1. What was the average real return for Treasury bills from 1926 through
1932?
2. Calculating Returns Refer to Table 10.1 in the text and look at the period from 1973 through 1980.
period.
a. Calculate the average return for Treasury bills and the average annual inflation rate (consumer price index) for this period.
b. Calculate the standard deviation of Treasury bill returns and inflation over this time period.
c. Calculate the real return for each year. What is the average real return for Treasury bills?
d. Many people consider Treasury bills to be risk-free. What does this tell you about the potential risks of Treasury bills?
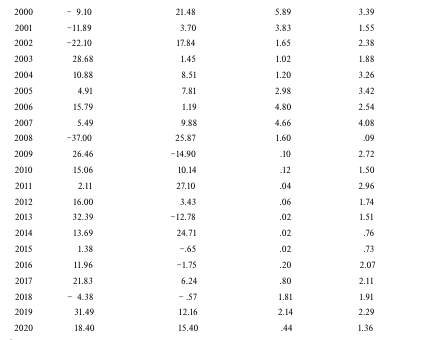
\begin{tabular}{rrrrr} 2000 & -9.10 & 21.48 & 5.89 & 3.39 \\ 2001 & -11.89 & 3.70 & 3.83 & 1.55 \\ 2002 & -22.10 & 17.84 & 1.65 & 2.38 \\ 2003 & 28.68 & 1.45 & 1.02 & 1.88 \\ 2004 & 10.88 & 8.51 & 1.20 & 3.26 \\ 2005 & 4.91 & 7.81 & 2.98 & 3.42 \\ 2006 & 15.79 & 1.19 & 4.80 & 2.54 \\ 2007 & 5.49 & 9.88 & 4.66 & 4.08 \\ 2008 & -37.00 & 25.87 & 1.60 & .09 \\ 2009 & 26.46 & -14.90 & .10 & 2.72 \\ 2010 & 15.06 & 10.14 & .12 & 1.50 \\ 2011 & 2.11 & 27.10 & .04 & 2.96 \\ 2012 & 16.00 & 3.43 & .06 & 1.74 \\ 2013 & 32.39 & -12.78 & .02 & 1.51 \\ 2014 & 13.69 & 24.71 & .02 & .76 \\ 2015 & 1.38 & -.65 & .02 & .73 \\ 2016 & 11.96 & -1.75 & .20 & 2.07 \\ 2017 & 21.83 & 6.24 & .80 & 2.11 \\ 2018 & -4.38 & -.57 & 1.81 & 1.91 \\ 2019 & 31.49 & 12.16 & 2.14 & 2.29 \\ 2020 & 18.40 & 15.40 & .44 & 1.36 \end{tabular}
Step by Step Solution
There are 3 Steps involved in it

Get step-by-step solutions from verified subject matter experts