

Question: CALCULATING THE PEARSON'S SAMPLE CORRELATION COEFFICIENT (ASYNC) Answer the problem below. . The following data represents the number of hours 12 different students watched television
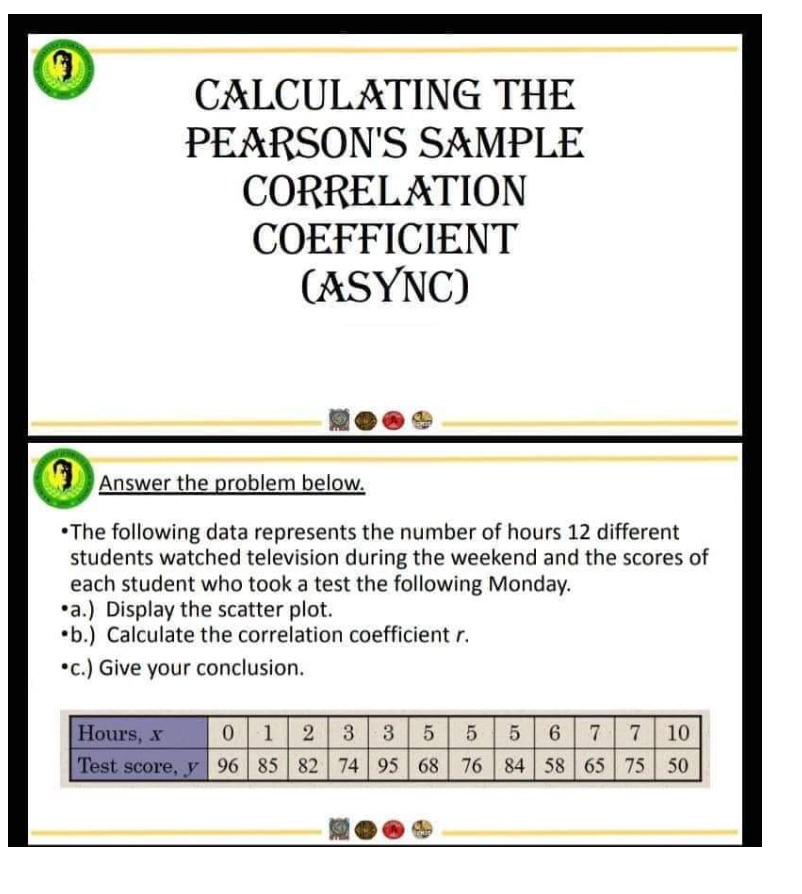
CALCULATING THE PEARSON'S SAMPLE CORRELATION COEFFICIENT (ASYNC) Answer the problem below. . The following data represents the number of hours 12 different students watched television during the weekend and the scores of each student who took a test the following Monday. .a.) Display the scatter plot. .b.) Calculate the correlation coefficient r. .c.) Give your conclusion. Hours, X 0 2 3 3 5 5 5 6 7 7 10 Test score, y 96 85 82 74 95 68 76 84 58 65 75 50
Step by Step Solution
There are 3 Steps involved in it
1 Expert Approved Answer
Step: 1 Unlock

Question Has Been Solved by an Expert!
Get step-by-step solutions from verified subject matter experts
Step: 2 Unlock
Step: 3 Unlock