

Question: Calculating the standard deviation for TVs at ABC Electronics The planner at ABC Electronics is trying to optimize stocking and ordering for a popular 50-inch
Calculating the standard deviation for TVs at ABC Electronics
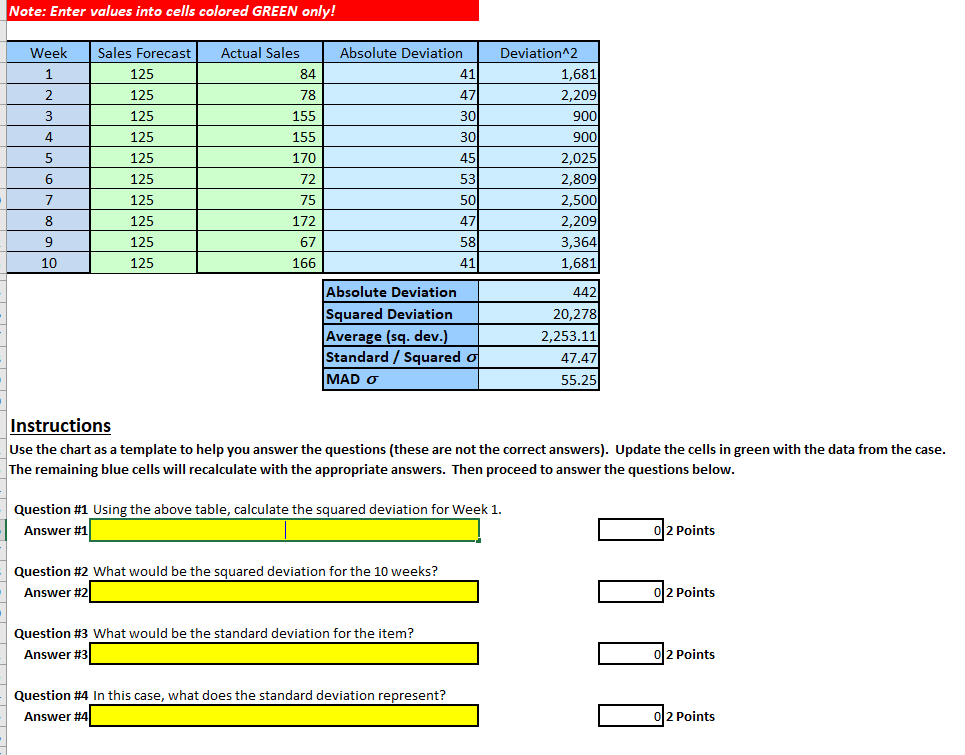
The planner at ABC Electronics is trying to optimize stocking and ordering for a popular 50-inch plasma TV it stocks. The first step is to look at the pattern of demand to calculate the rate of sales. After looking back over the past 10 weeks of sales, the planner has determined the actual sales on the TV and has placed the values in the table below. The average of number of TVs sold during that period was 125.
Step by Step Solution
There are 3 Steps involved in it
1 Expert Approved Answer
Step: 1 Unlock

Question Has Been Solved by an Expert!
Get step-by-step solutions from verified subject matter experts
Step: 2 Unlock
Step: 3 Unlock