

Question: Calculation & Discussion Question Answers Please!!! Background: Spectroscopy is the study of how light is generated and how it interacts with matter to probe into
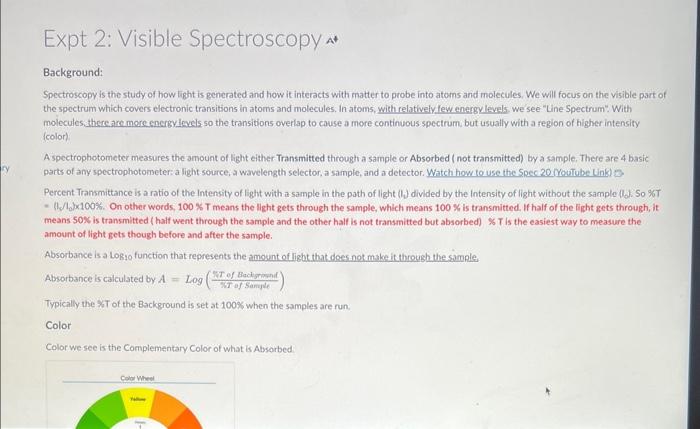
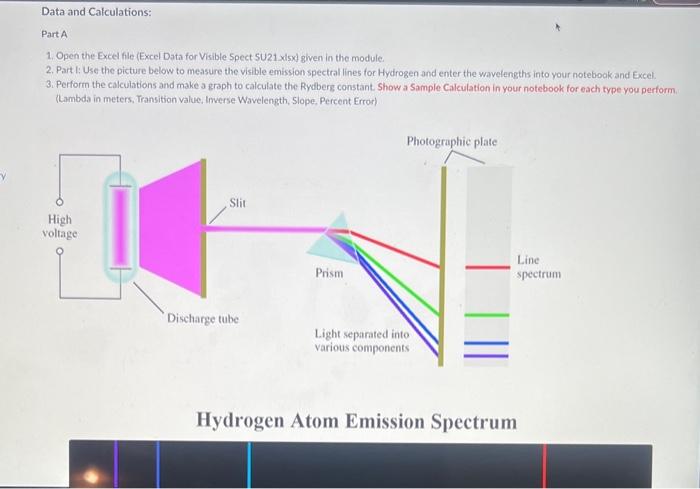
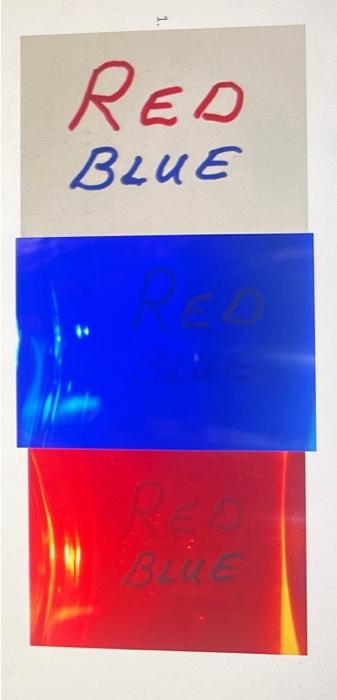
Background: Spectroscopy is the study of how light is generated and how it interacts with matter to probe into atoms and molecules. We will focus on the visible part of the spectrum which covers electronic transitions in atoms and molecules, In atoms, with relatively few energylevels, we see "Line Spectrum". With molecules there are more energy levels so the transitions overlap to cause a more continuous spectrum but usually with a region of higher intensity (color) A spectrophotometer measures the amount of light either Transmitted through a sample or Absorbed ( not transmitted) by a sample. There are 4 basic parts of any spectrophotometer a light source, a wavelength selector, a sample, and a detector. Watch how to use the Spec 20 (Youtube Unkl 8 Percent Transmittance is a ratio of the Intensity of light with a sample in the path of light (1) divided by the intensity of light without the sample (Id. So %. - (t./1/0 100%. On other words, 100%T means the light gets through the sample, which means 100K is transmitted. If half of the fight gets through, it means 50K is transmitted ( half went through the sample and the other half is not transmitted but absorbed) %T is the easiest way to measure the amount of light gets though before and after the sample. Absorbance is a Logio function that represents the amount of light that does not make it through the sample. Absorbance is calculated by A=log(KTofSanuleETofBachrosend) Typically the $1 of the Background is set at 100% when the samples are run. Color Color we see is the Complementary Color of what is Absorbed Data and Calculations: Part A 1. Open the Excel file (Excel Data for Visible Spect SU21 xisx) given in the module. 2. Part I: Use the picture below to measure the visible emission spectral lines for Hydrogen and enter the wavelengths into your notebook and Excel. 3. Perform the calculations and make a graph to calculate the Rydberg constant. Show a Sample Calculation in your notebook for each type you perform. (Lambda in meters, Transition value, Inverse Wavelength, Slope, Percent Error) Hydrogen Atom Emission Spectrum Part It 1. Open PhET Simulation "Beer's Law" (Simulation E.) or got to the website (https: Pphetcolorado.edu/en/simulation/beers-taw-tab) 2. You can either run the simulation on the website or download it to your device. 3. Once in the simulation, fun the "Beer's Law" part. 4. Watch the yidie linked in this Module to show how it is used to collect spectral data. 5. Enter the XST data you collect into your notebook and then into Excel. Calculate the Absorbances and make the required graphs. (see the Excel document and video for further instructions) 6. Calculate the Absorbancies at each wavelength (Show one Sample Calculation) Part C 1. Use the 'Variable: light source in the Phet simulator to scan and record the ranges of wavelengths that correspond to the colors Blue, Green, Yellow, and Orange. 2. Enter the data into your notebook. Part D 1. Record your obvervations in your notebook of looking through the red and blue solutions at the red and blue letters/lines on the notecard. (You can use the picture below if you do not have access to food coloring) Discussion Questions: (Write answers in your notebook) 1. There are two versions of the Rydberg equation we have been using. One constant is 1.097107m1 and the other constant is 2.178101j. The experimental value from part 1 should match the first value. Show that the second yalue is the same by converting your experimental value in m - to 1 Joules using Planck's constant and the speed of light value. (Also, ignore the negative sign and work with absolute value as this is only for direction. 2. Write a short discussion paragraph (2-3 sentences) describing the differences between an atomic spectrum and a molecular spectrum and the cause of those differences. 3. Write a short paragraph describing how your spectrum for the colored solutions is consistent iminimum /maximum transmittance and absorption) with the observed color of the solutions. Include in your discussion which colors are absorbed, which are transmitted, and the wavelengths of these colors. (Hint: Look at the "Color Wheel" for complementary colors) 4. When viewing the Red letters/lines (Part D) through the Red and Blue solutions, which solution made the Red letters/lines appear darker? Briefly explain why
Step by Step Solution
There are 3 Steps involved in it

Get step-by-step solutions from verified subject matter experts