

Question: Calculations & Analysis Component 1. Create a comparative balance sheet by calculating the dollar change and percent change . 2. Using the figures provided on
 Calculations & Analysis Component
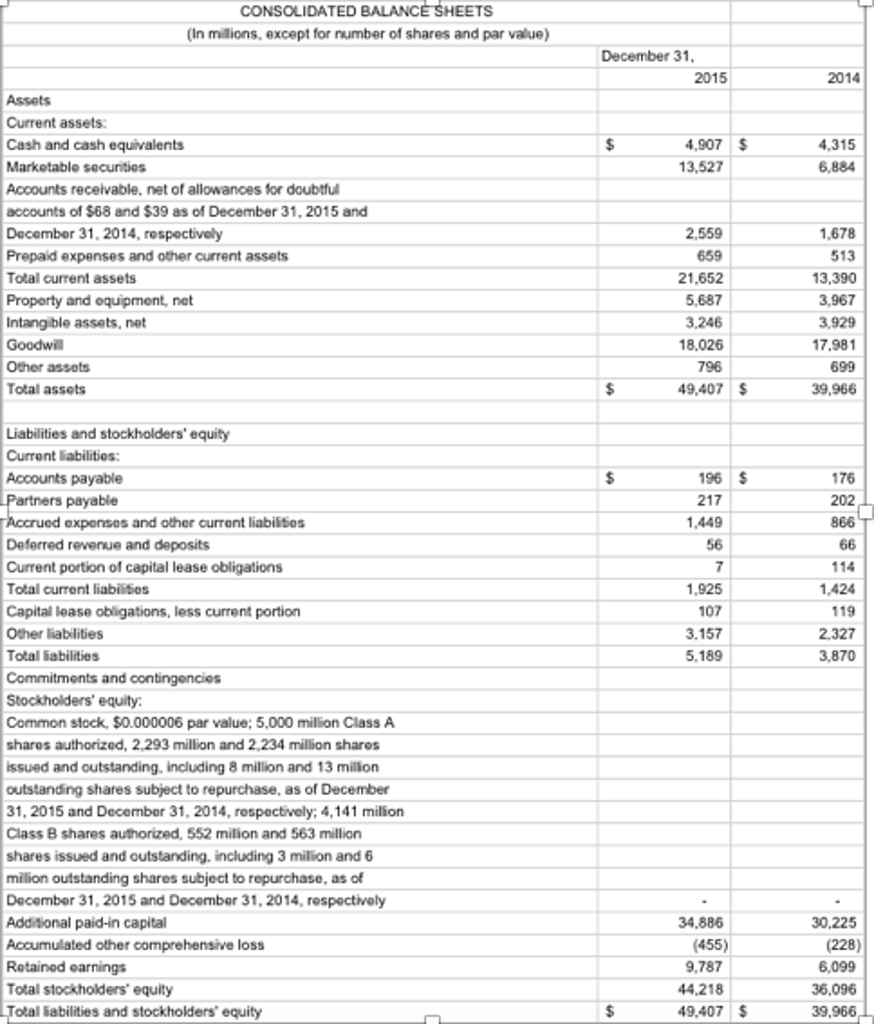
1. Create a comparative balance sheet by calculating the dollar change and percent change.
2. Using the figures provided on the balance sheet, calculate a) Current ratio b) Debt ratio c) Equity ratiofor both years.
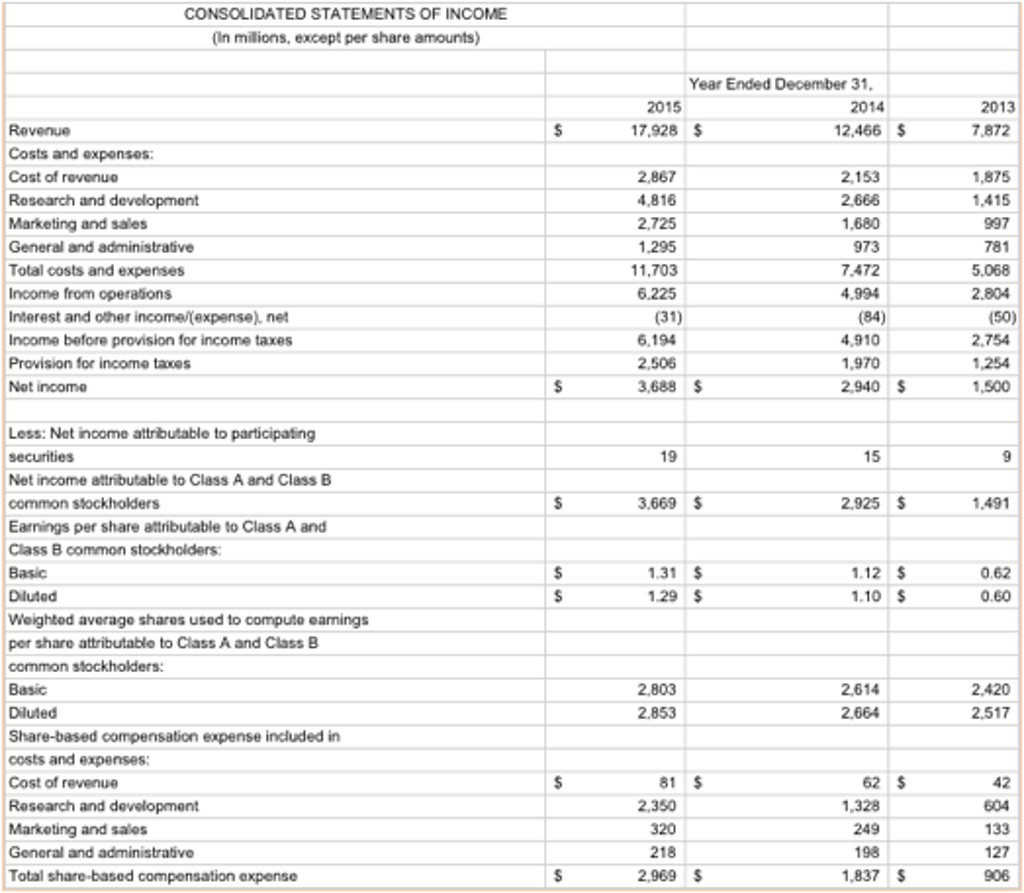
3. Create a common size comparative income statement by dividing every item on the income statement by Revenues for both years.
4. Using the figures provided on the income statement, calculate a) Gross margin ratio, b) Profit margin ratio.
5. In which year was the company more liquid and why?
6. Was the company financed by more debt or more equity in 2014 and 2015 and why?
7. What trends do you see on the balance sheet?
8. In which year did the company retain a higher gross margin? Why do you think this was the case? (lower or higher cost of sales as % of revenues?).
9. In which year did the company retain a higher profit margin? Why do you think that was the case? (lower or higher expenses?)
CONSOLIDATED BALANCE SHEETS (In milions, except for number of shares and par value) 2015 2014 Current assets: Cash and cash equivalents 4,907 13,527 4.315 6.884 Accounts receivable. net of allowances for doubtfu accounts of $68 and $39 as of December 31, 2015 and December 31, 2014, respectively Prepaid expenses and other current assets Total current assets Proporty and oquipment, net Intangible assets, net Goodwi Other assets Total assets 2,559 659 21.652 5,687 3,246 18.026 1,678 13,390 3,967 3,929 7,981 699 39,966 49.407 $ Liabilities and stockholders' equity Current labilitios Accounts payable 196 217 449 176 artners payable exponsos and other current liabilitios 866T Deferred revenue and deposits Current portion of capital lease obligations Total current liabilisos Capital lease obligations, less current portion Other liabilities Total iabilities Commitments and contingencies ,925 107 3.157 5,189 114 1.424 119 2.327 3,870 Common stock, $0.000006 par value; 5,000 million Class A shares authorized, 2,293 million and 2,234 million shares ssued and outstanding, including 8 million and 13 millon outstanding shares subject to repurchase, as of December 31, 2015 and Decembor 31, 2014, rospoctively; 4,141 milion Class B shares authorized, 552 milion and 563 million shares issued and outstanding. including 3 milion and 6 milion outstanding shares subject to repurchase, as of December 31,2015 and Decembor 31, 2014, respectively Additional paid-in capital Accumulated other comprehensive loss Retained earnings Total stockholders equity 34.886 (455) 9.787 44.218 49.407 8) 6,099 36.096 39,966 otal iabilities and stockholders equity
Step by Step Solution
There are 3 Steps involved in it

Get step-by-step solutions from verified subject matter experts