

Question: CALCULATIONS The basic calculates are the same as we have been practicing, but: 1. Instead of using S or $2, you use SS 2 .
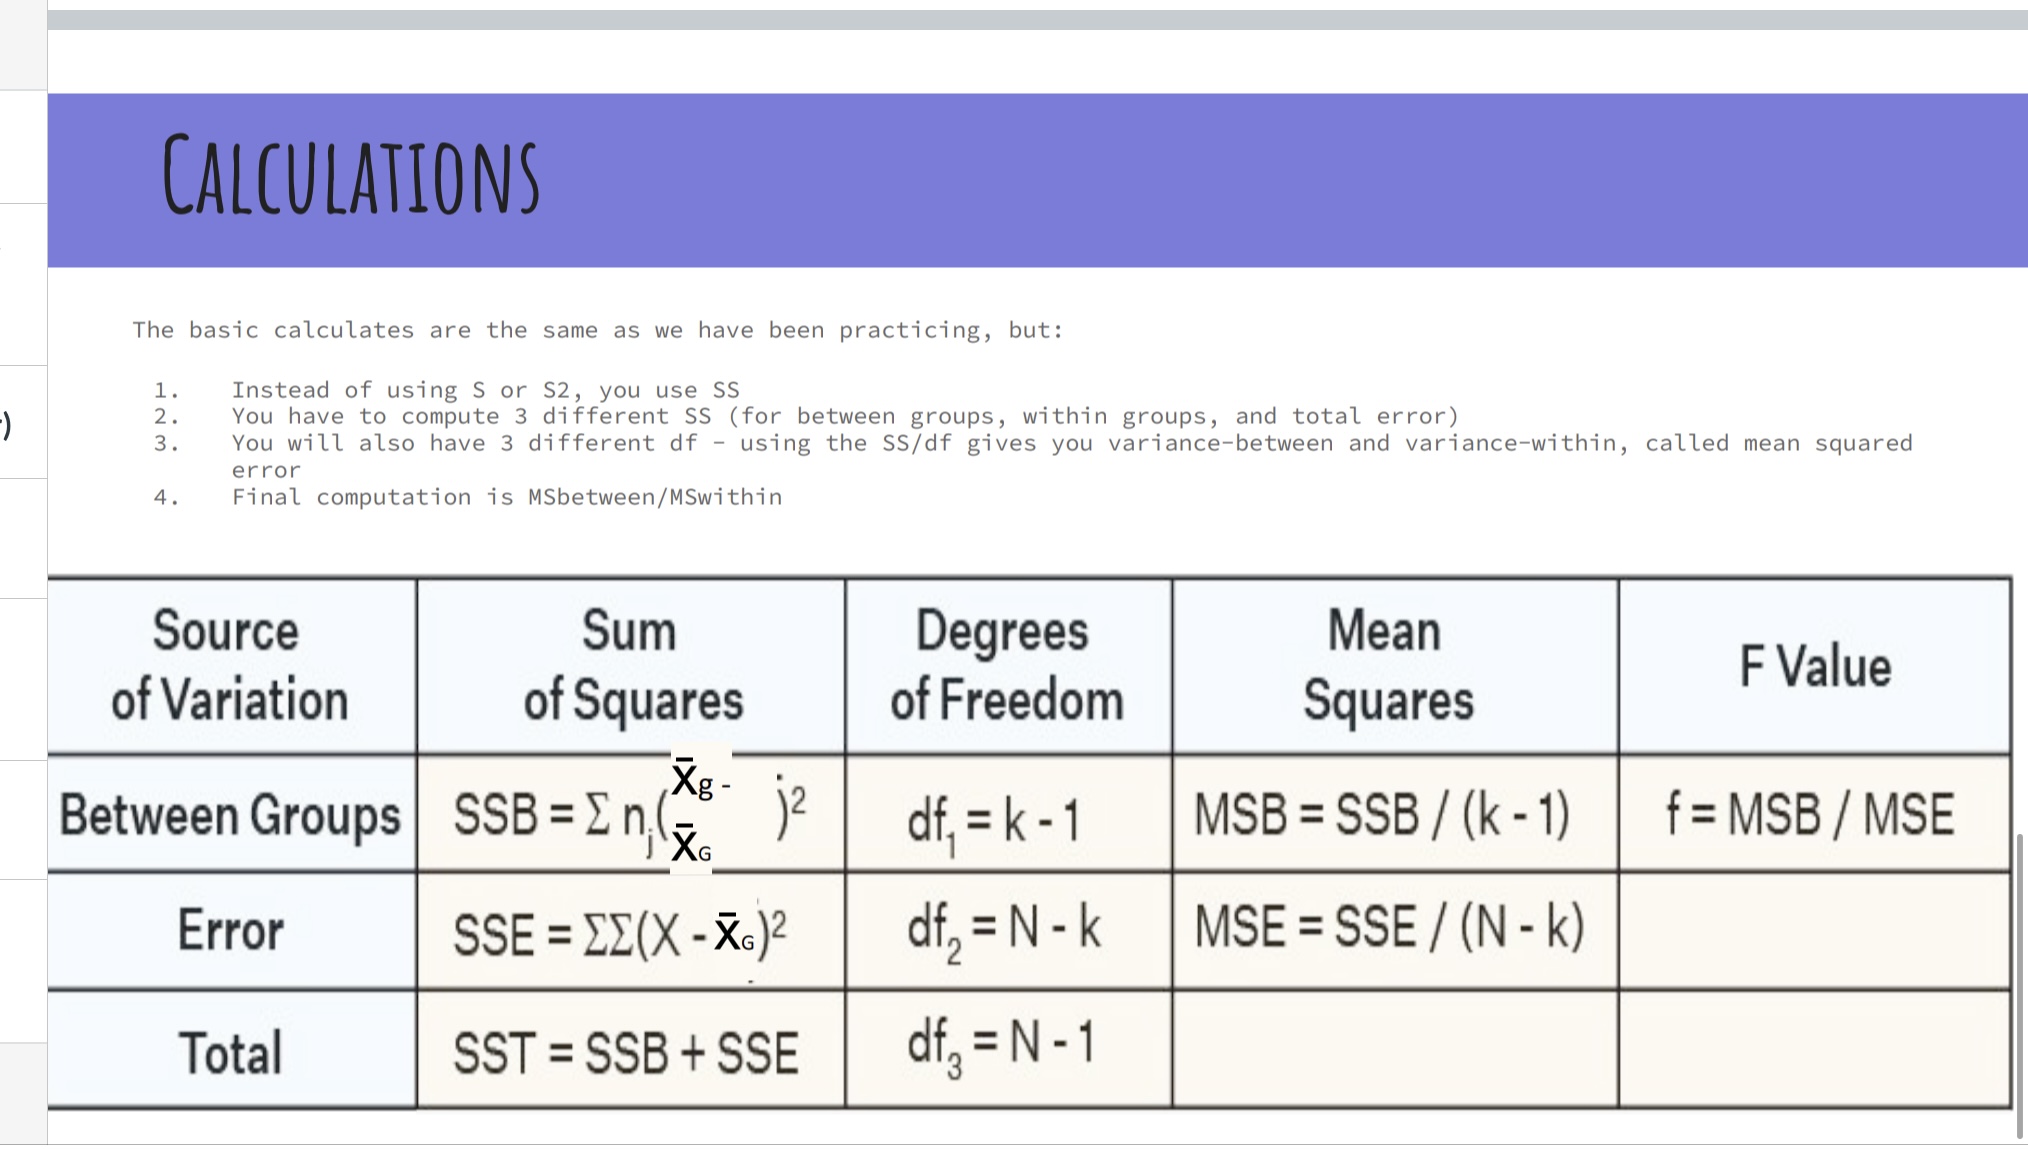
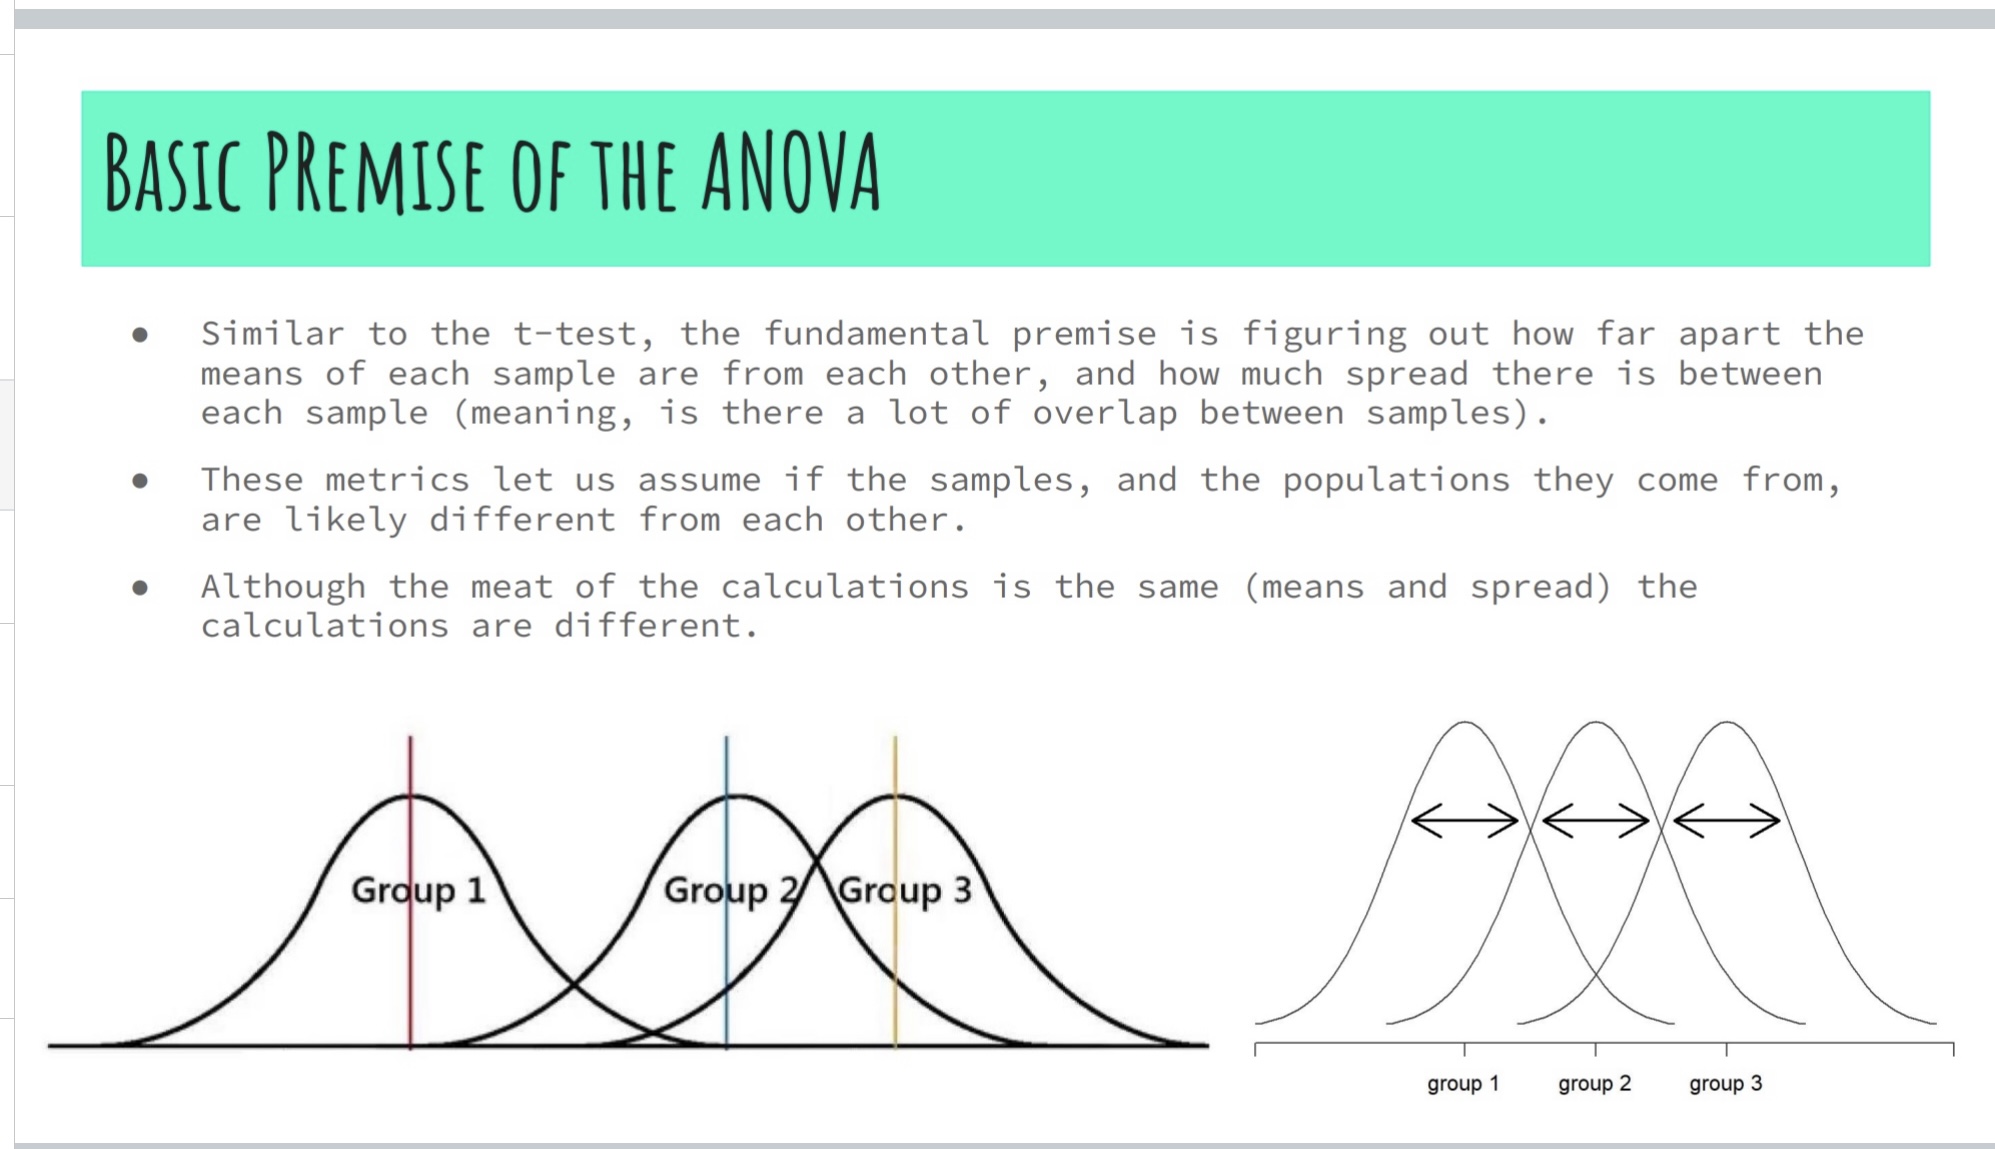
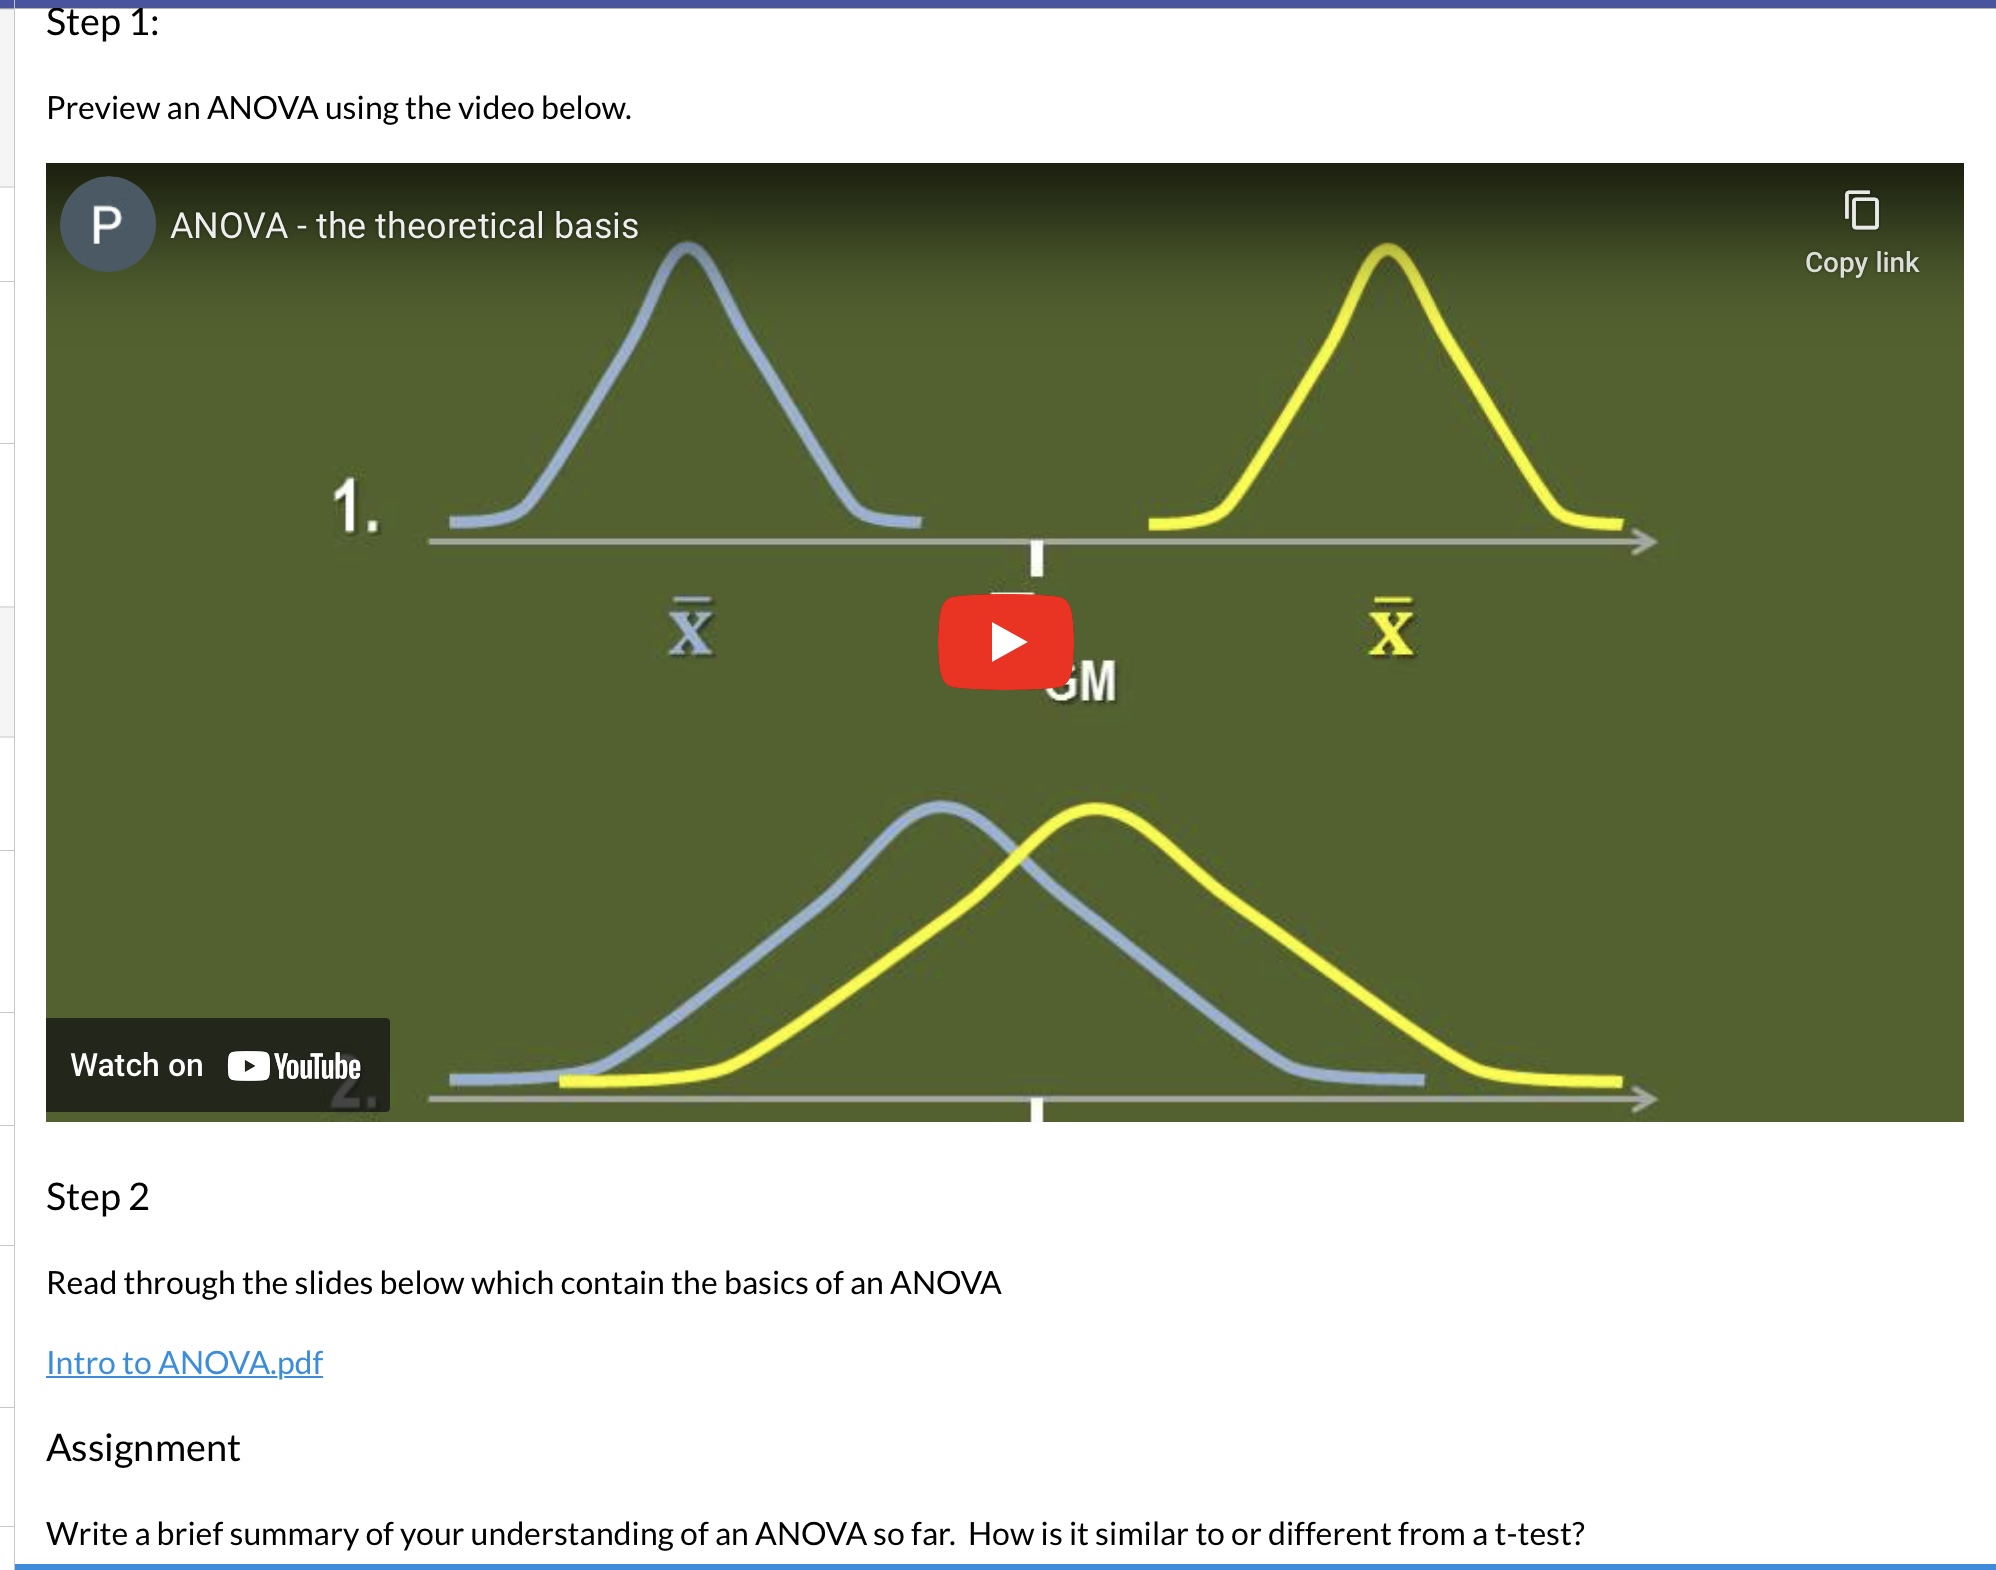
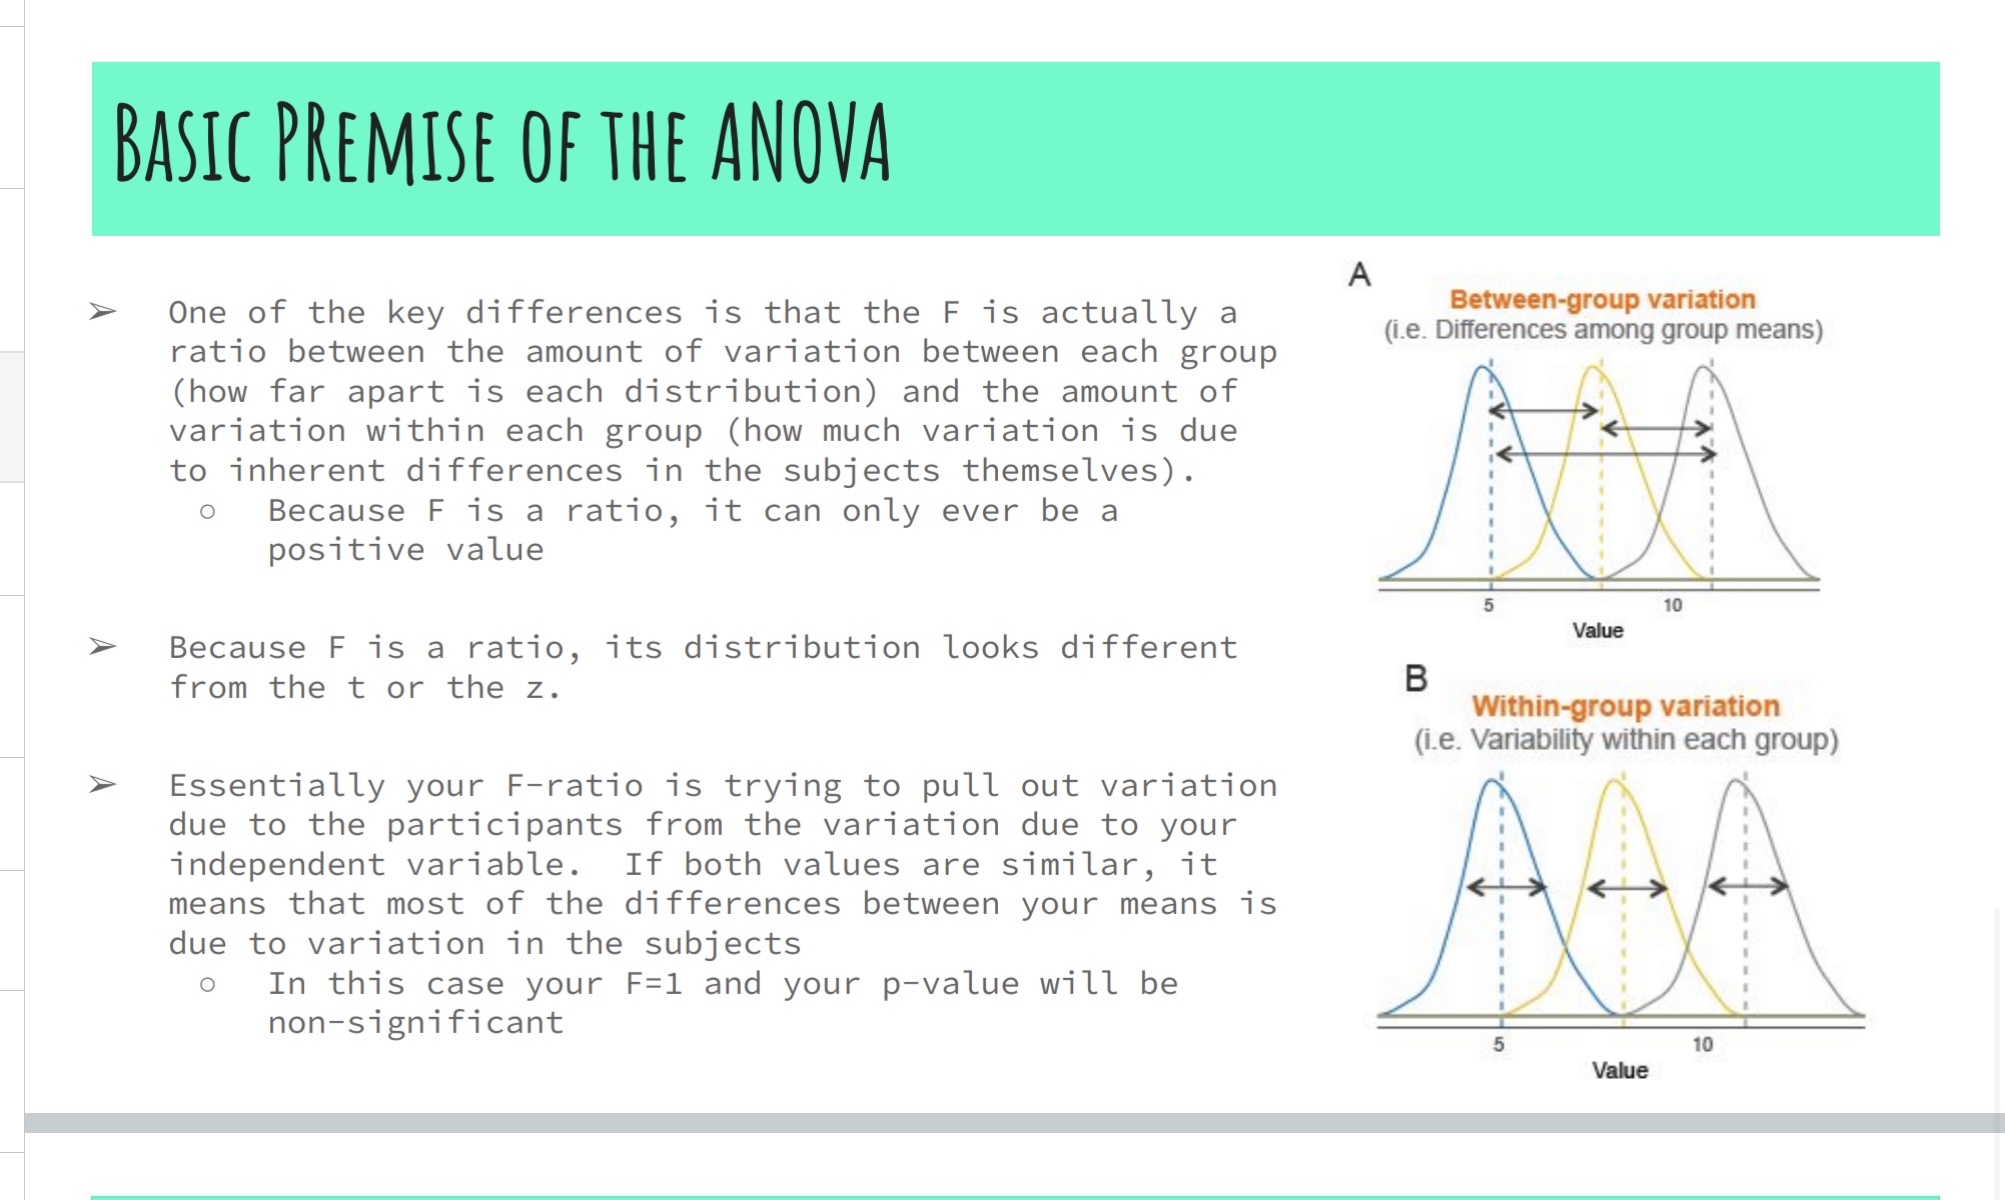
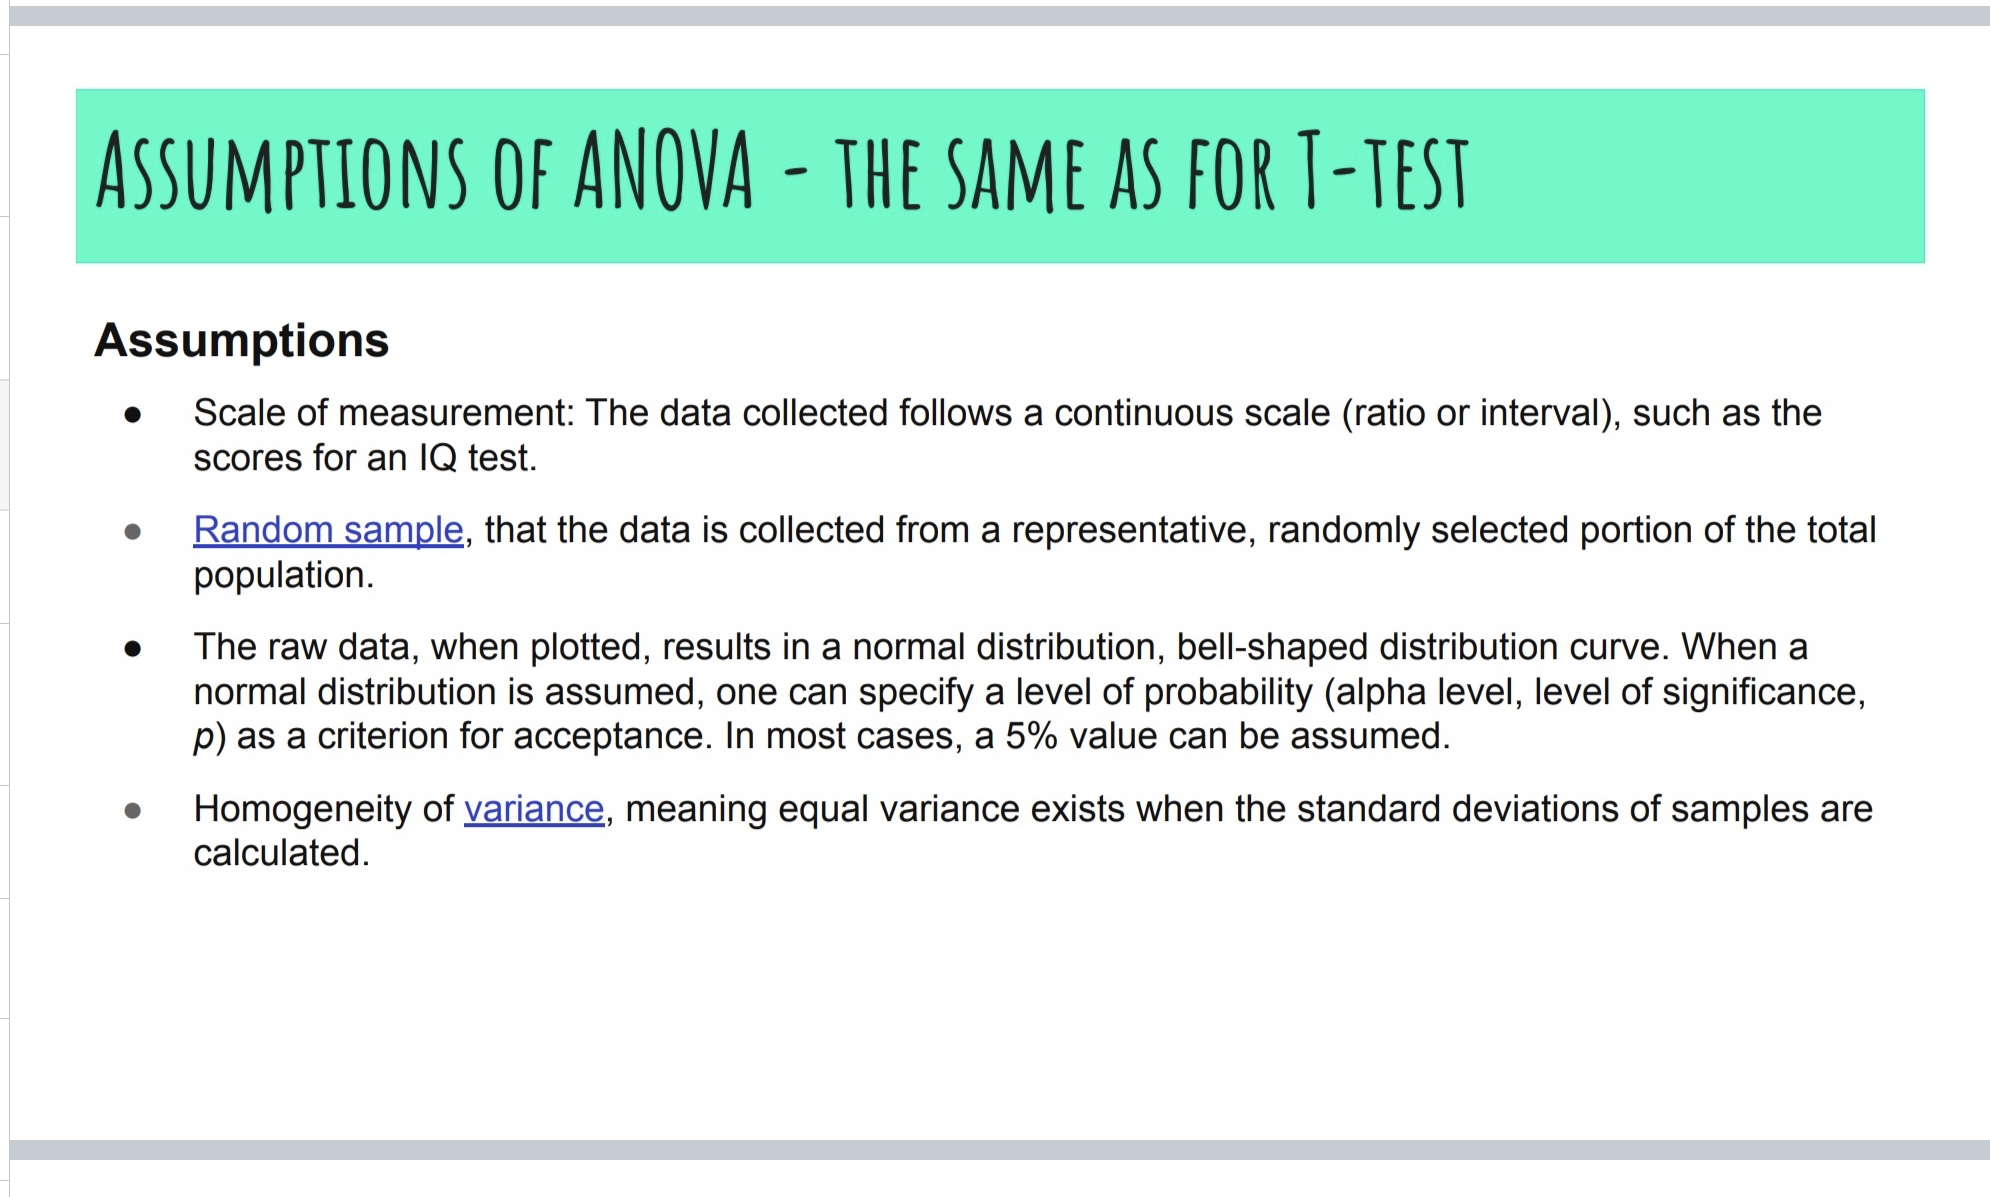
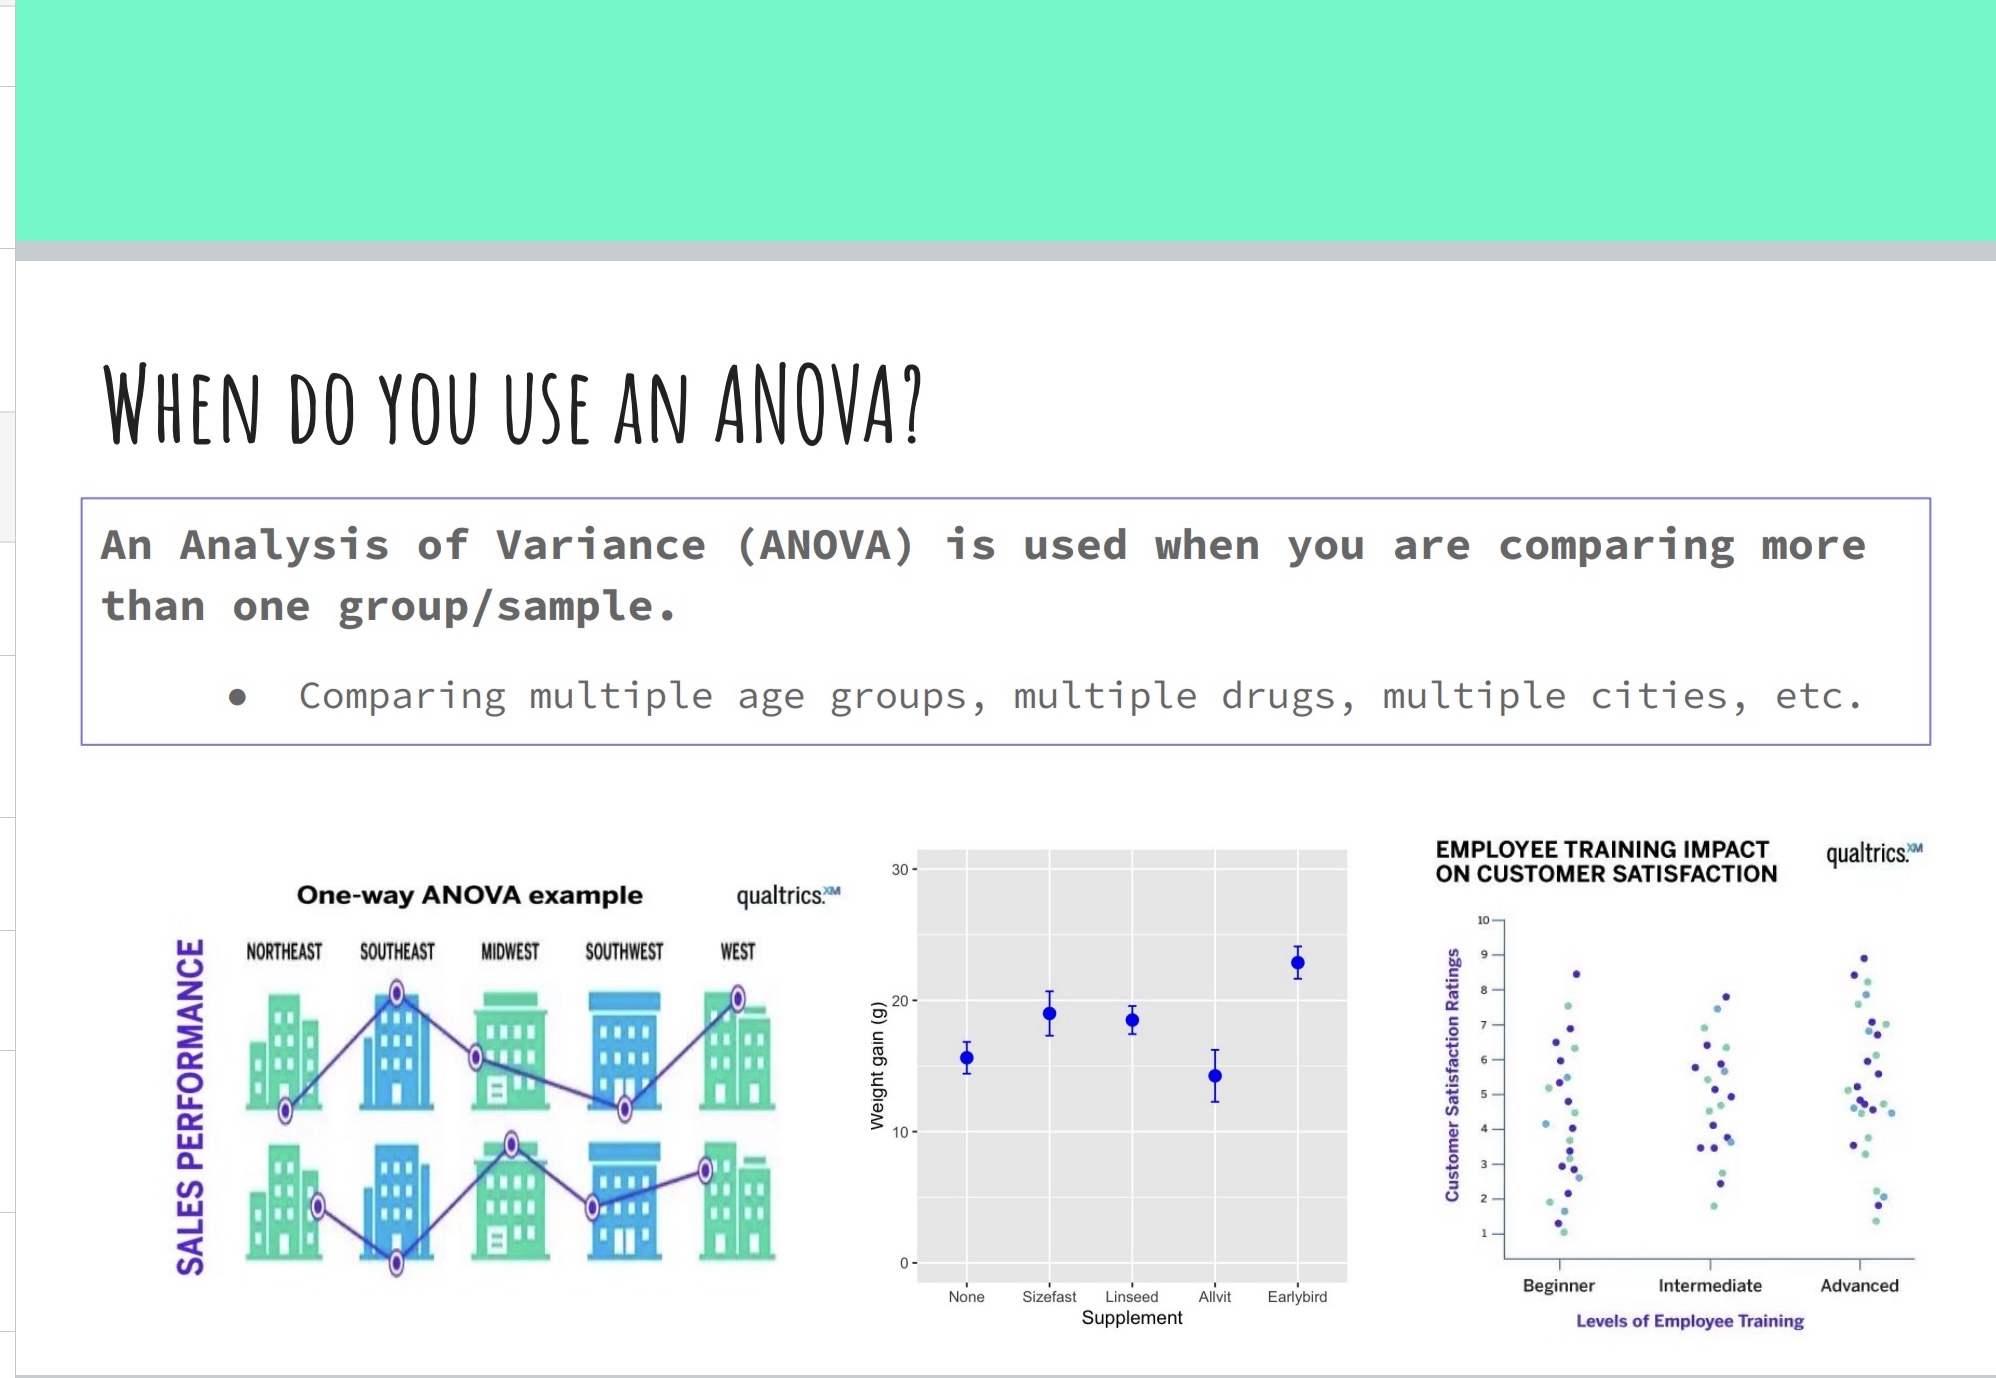
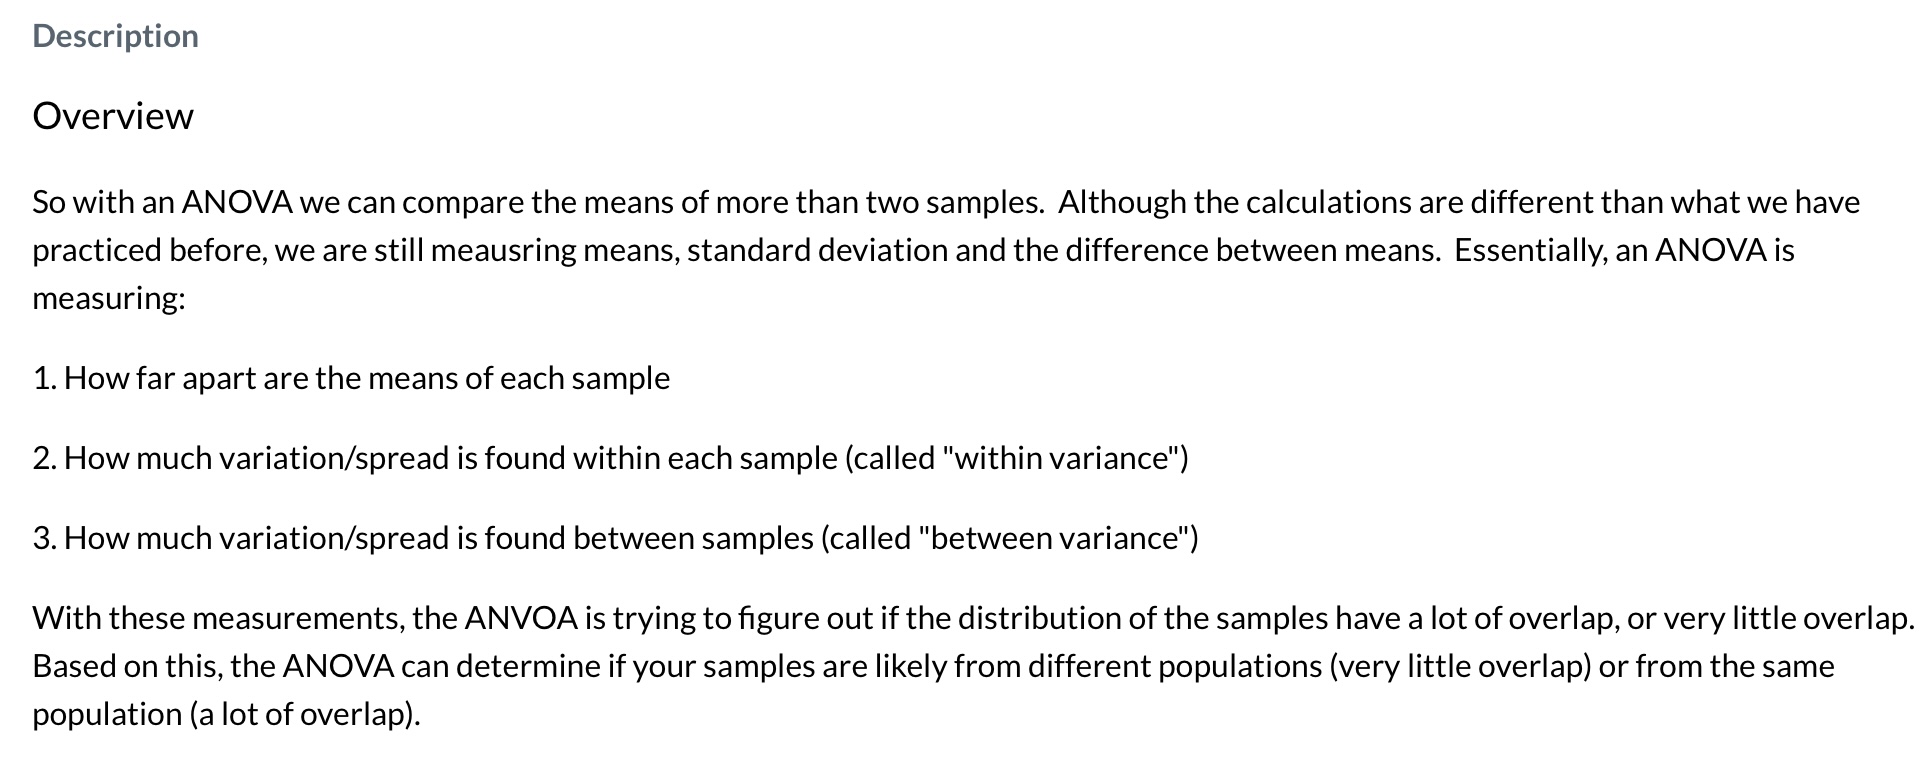
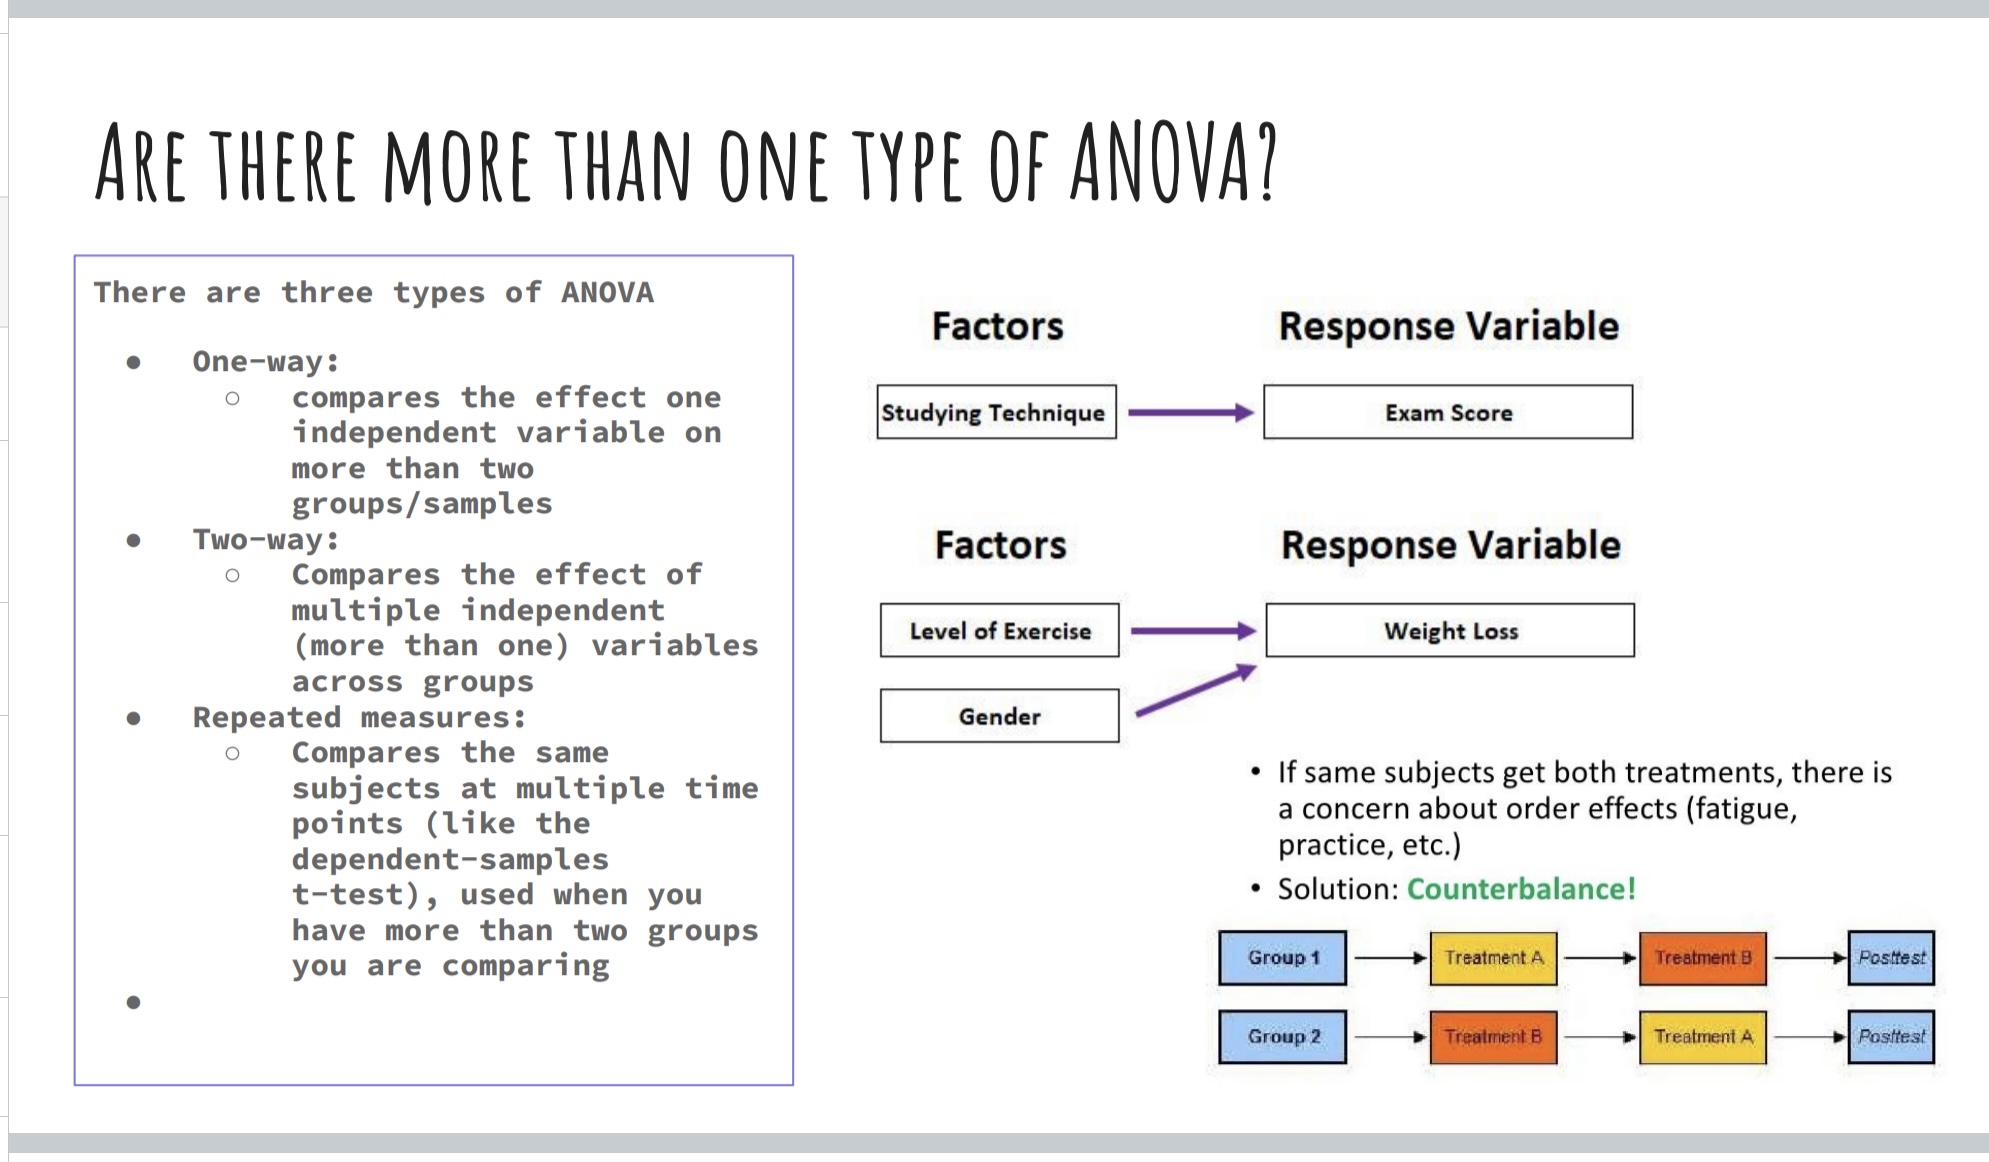
CALCULATIONS The basic calculates are the same as we have been practicing, but: 1. Instead of using S or $2, you use SS 2 . You have to compute 3 different SS (for between groups, within groups, and total error) 3. You will also have 3 different df - using the SS/df gives you variance-between and variance-within, called mean squared error 4 . Final computation is MSbetween/MSwithin Source Sum Degrees Mean F Value of Variation of Squares of Freedom Squares Xg - Between Groups SSB = En. j2 XG df, = k - 1 MSB = SSB / (k - 1) f = MSB / MSE Error SSE = EE(X -XG)2 df, = N - k MSE = SSE / (N - k) Total SST = SSB + SSE df, = N - 1BASIC PREMISE OF THE ANQVA e Similar to the t-test, the fundamental premise 1is figuring out how far apart the means of each sample are from each other, and how much spread there is between each sample (meaning, 1is there a lot of overlap between samples). e These metrics let us assume if the samples, and the populations they come from, are likely different from each other. e Although the meat of the calculations 1is the same (means and spread) the calculations are different. AL T group 1 group 2 group 3 Step 1: Preview an ANOVA using the video below. P ANOVA - the theoretical basis O Copy link 1. X Watch on Youtube Step 2 Read through the slides below which contain the basics of an ANOVA Intro to ANOVA.pdf Assignment Write a brief summary of your understanding of an ANOVA so far. How is it similar to or different from a t-test?BASIC PREMISE OF THE ANOVA One.of the key differences 1is tl'.wat'the F is actually a (i.e. Differences among group means) ratio between the amount of variation between each group : (how far apart 1is each distribution) and the amount of variation within each group (how much variation 1is due to inherent differences in the subjects themselves). o Because F is a ratio, it can only ever be a positive value 10 Because F 1is a ratio, its distribution looks different - from the t or the z. L i Within-group variation (i.e. Variability within each group) Essentially your F-ratio 1is trying to pull out variation ) due to the participants from the variation due to your independent variable. If both values are similar, it means that most of the differences between your means is = due to variation in the subjects o In this case your F=1 and your p-value will be non-significant s = ASSUMPTIONS OF ANOVA - THE SAME AS FOR T-TEST Assumptions e Scale of measurement: The data collected follows a continuous scale (ratio or interval), such as the scores for an 1Q test. e Random sample, that the data is collected from a representative, randomly selected portion of the total population. e The raw data, when plotted, results in a normal distribution, bell-shaped distribution curve. When a normal distribution is assumed, one can specify a level of probability (alpha level, level of significance, p) as a criterion for acceptance. In most cases, a 5% value can be assumed. e Homogeneity of variance, meaning equal variance exists when the standard deviations of samples are calculated. WHEN DO YOU USE AN ANOVA? An Analysis of Variance (ANOVA) is used when you are comparing more than one group/sample. . Comparing multiple age groups, multiple drugs, multiple cities, etc. EMPLOYEE TRAINING IMPACT 30 - qualtrics. ON CUSTOMER SATISFACTION One-way ANOVA example qualtrics. NORTHEAST SOUTHEAST MIDWEST SOUTHWEST WEST 20 IIII Weight gain (9) Customer Satisfaction Ratings SALES PERFORMANCE 10 . . . II' 0 - None Sizefast Linseed Allvit Earlybird Beginner Intermediate Advanced Supplement Levels of Employee TrainingTHIS SLIDE CONTAINS SOME OPTIONAL REVIEW QUESTIONS 1. What are the assumptions of a t-test - create an example of a hypothetical experiment that meets the assumptions and an example an experiment that violates the assumptions 2. What are the 4 principles of the central limit theorem and how do they apply to a t-test (distribution/assumptions/calculation?)? What is an effect size telling you, and why report 1it? 4, What are confidence intervals telling you, and why report 1it? Create a hypothetical experiment where you might want to use a z-score, a one-sample t-test, a two-sample t-test, or a dependent-samples t-test. Description Overview So with an ANOVA we can compare the means of more than two samples. Although the calculations are different than what we have practiced before, we are still meausring means, standard deviation and the difference between means. Essentially,an ANOVA is measuring: 1. How far apart are the means of each sample 2. How much variation/spread is found within each sample (called "within variance") 3. How much variation/spread is found between samples (called "between variance") With these measurements, the ANVOA is trying to figure out if the distribution of the samples have a lot of overlap, or very little overlap. Based on this, the ANOVA can determine if your samples are likely from different populations (very little overlap) or from the same population (a lot of overlap). ARE THERE MORE THAN ONE TYPE OF ANQVAT There are three types of ANOVA One-way: o compares the effect one independent variable on more than two groups/samples e Two-way: o Compares the effect of multiple independent (more than one) variables across groups e Repeated measures: o Compares the same subjects at multiple time points (like the dependent-samples t-test), used when you have more than two groups you are comparing Factors Response Variable prameretgs] + [ oo Factors Response Variable [ | s [ v ] * If same subjects get both treatments, there is a concern about order effects (fatigue, practice, etc.) * Solution: Counterbalance! (o] o] = = B = =
Step by Step Solution
There are 3 Steps involved in it

Get step-by-step solutions from verified subject matter experts