

Question: Calculator commands and proper labels required. Round probabilities, test statistics, critical values and P values to the thousands. 3. The age of random drivers and
Calculator commands and proper labels required. Round probabilities, test statistics, critical values and P values to the thousands.
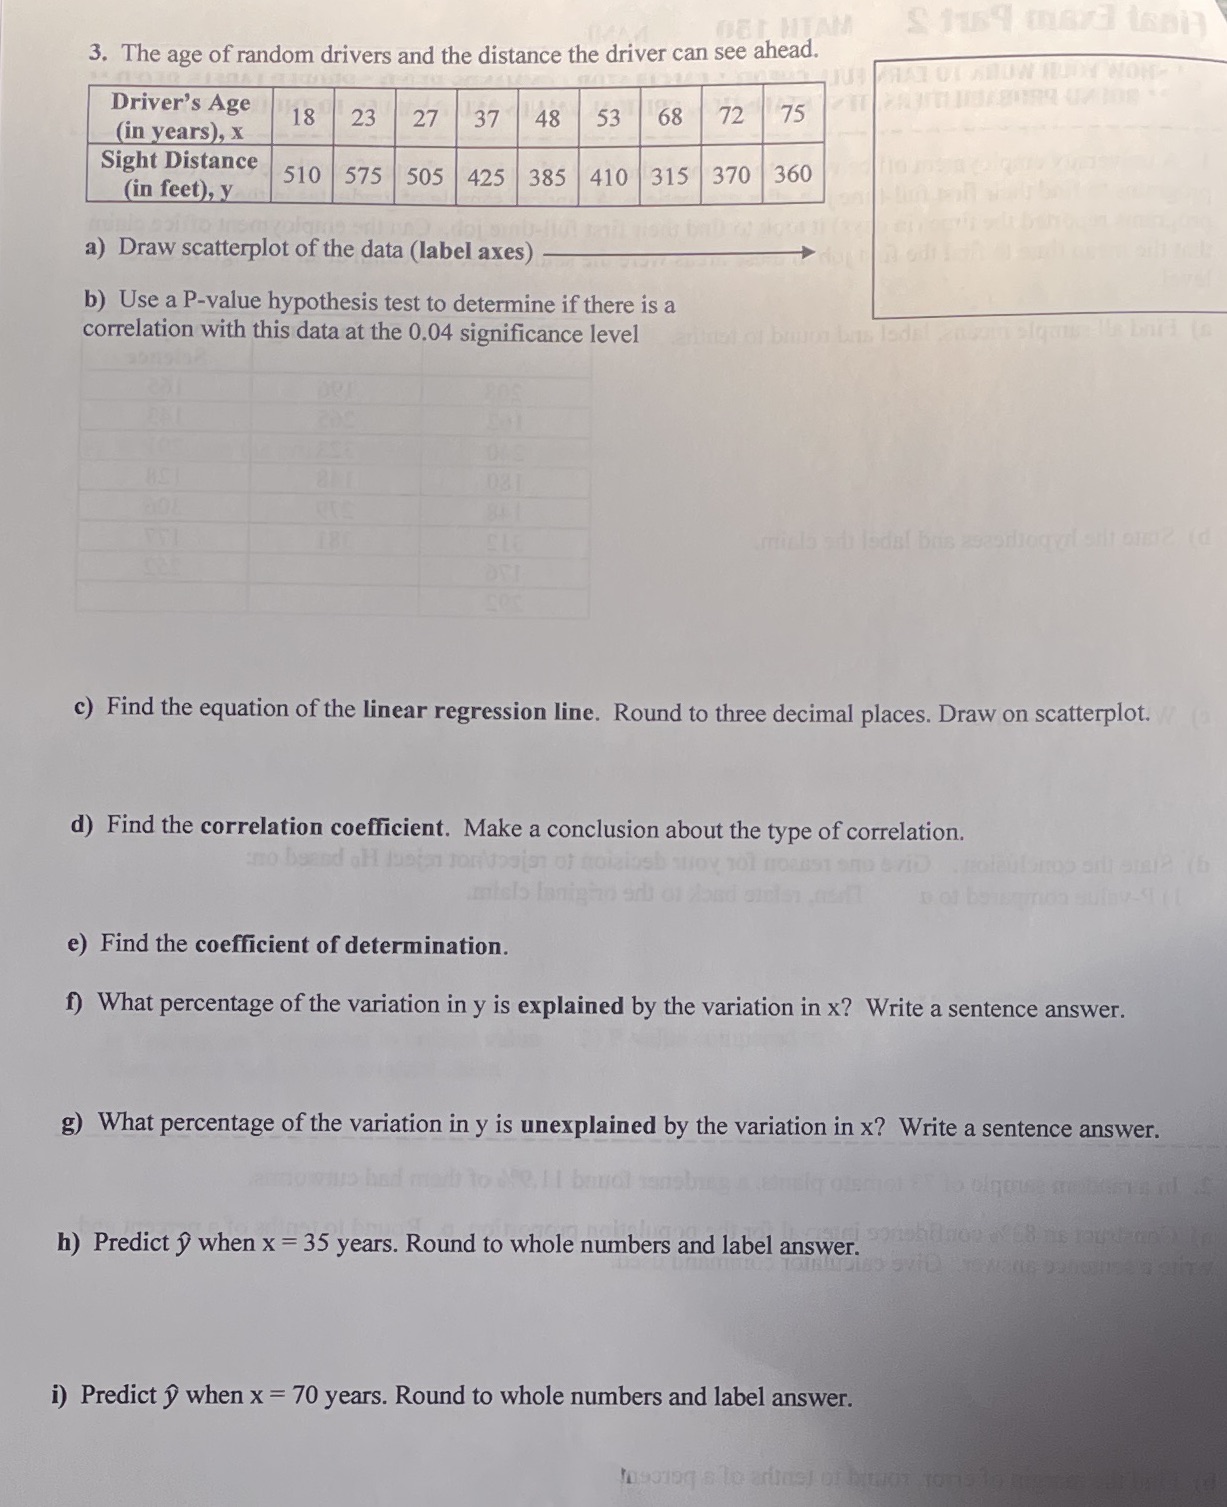
3. The age of random drivers and the distance the driver can see ahead. Driver's Age 18 48 68 72 75 (in years), x 23 27 37 53 Sight Distance (in feet), y 510 575 505 425 385 410 315 370 360 a) Draw scatterplot of the data (label axes) b) Use a P-value hypothesis test to determine if there is a correlation with this data at the 0.04 significance level milo sby lodal bris ase c) Find the equation of the linear regression line. Round to three decimal places. Draw on scatterplot. d) Find the correlation coefficient. Make a conclusion about the type of correlation. mislo Inninein sri of e) Find the coefficient of determination. () What percentage of the variation in y is explained by the variation in x? Write a sentence answer. g) What percentage of the variation in y is unexplained by the variation in x? Write a sentence answer. prono had marly to see, 1 1 banjol sansbags h) Predict y when x = 35 years. Round to whole numbers and label answer. i) Predict D when x = 70 years. Round to whole numbers and label
Step by Step Solution
There are 3 Steps involved in it

Get step-by-step solutions from verified subject matter experts