

Question: CALCULATOR PRINTER VERSION BACK December 31 (in millions) Total current assets Noncurrent assets Total assets 2022 $2,825 10,750 $13,575 2021 $4,750 12,480 $17,230 Current liabilities
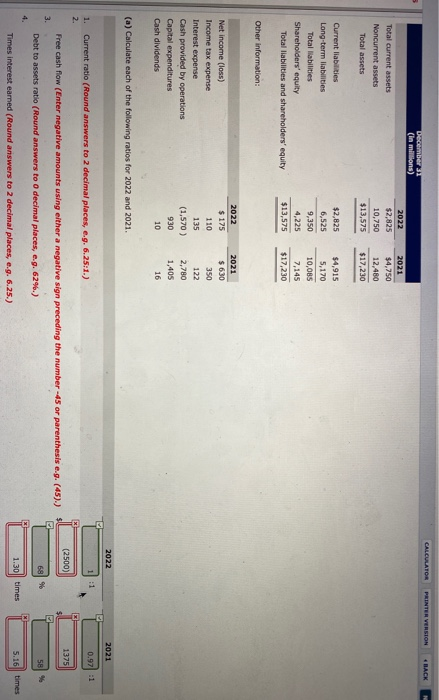
CALCULATOR PRINTER VERSION BACK December 31 (in millions) Total current assets Noncurrent assets Total assets 2022 $2,825 10,750 $13,575 2021 $4,750 12,480 $17,230 Current liabilities Long-term liabilities Total liabilities Shareholders' equity Total liabilities and shareholders' equity $2,825 6,525 9,350 4,225 $13,575 $4,915 5,170 10,085 7,145 $17,230 Other information: Net Income (loss) Income tax expense Interest expense Cash provided by operations Capital expenditures Cash dividends 2022 $ 175 110 135 (1,570) 930 10 2021 $ 630 350 122 2,780 1,405 16 (a) Calculate each of the following ratios for 2022 and 2021. 2022 2021 Current ratio (Round answers to 2 decimal places, e.g. 6.25:1.) 1 :1 1. 2. 0.97 :1 (2500) 1375 Free cash flow (Enter negative amounts using either a negative sign preceding the number -45 or parenthesis e.g. (45).) 3. 689 58 % Debt to assets ratio (Round answers to 0 decimal places, e.g. 62%.) 4. X 1.30|| times 5.16 times Times interest earned (Round answers to 2 decimal places, e.g. 6.25.)
Step by Step Solution
There are 3 Steps involved in it

Get step-by-step solutions from verified subject matter experts