

Question: Calculus Application Problem #4 Name Walk This Way Due date and Time: 1. The Problem A person walks away from a motion detector for a
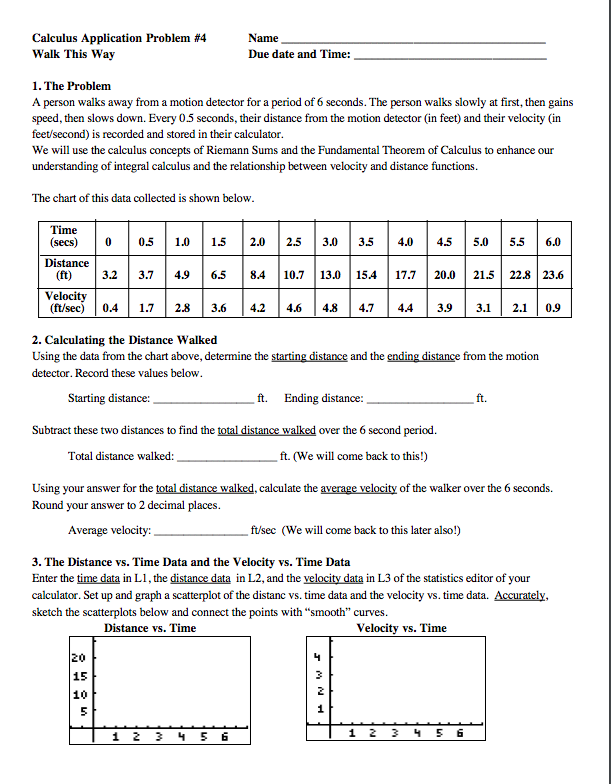
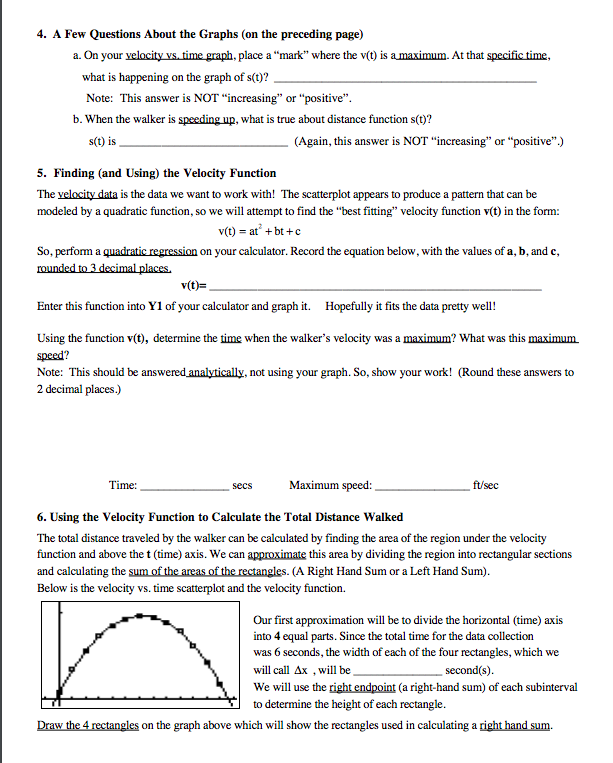
Calculus Application Problem #4 Name Walk This Way Due date and Time: 1. The Problem A person walks away from a motion detector for a period of 6 seconds. The person walks slowly at first, then gains speed, then slows down. Every 05 seconds, their distance from the motion detector (in feet) and their velocity (in feet/second) is recorded and stored in their calculator. We will use the calculus concepts of Riemann Sums and the Fundamental Theorem of Calculus to enhance our understanding of integral calculus and the relationship between velocity and distance functions. The chart of this data collected is shown below. Time (secs) 0.5 1.0 1.5 2.0 2.5 3.0 3.5 4.0 4.5 5.0 5.5 6.0 Distance (it) 3.2 3.7 4.9 6.5 8.4 10.7 13.0 15.4 17.7 20.0 21.5 22.8 23.6 Velocity (ft/sec) D.A 1.7 2.8 3.6 4.2 4.6 4.7 1.4 3.9 3.1 2.1 0.9 2. Calculating the Distance Walked Using the data from the chart above, determine the starting distance and the ending distance from the motion detector. Record these values below. Starting distance: ft. Ending distance: ft. Subtract these two distances to find the total distance walked over the 6 second period. Total distance walked: ft. (We will come back to this!) Using your answer for the total distance walked, calculate the average velocity of the walker over the 6 seconds. Round your answer to 2 decimal places. Average velocity: fu/sec (We will come back to this later also!) 3. The Distance vs. Time Data and the Velocity vs. Time Data Enter the time data in LI, the distance data in L2, and the velocity data in L3 of the statistics editor of your calculator. Set up and graph a scatterplot of the distancevs. time data and the velocity vs. time data. Accurately, sketch the scatterplots below and connect the points with "smooth" curves. Distance vs. Time Velocity vs. Time 20 15 10 5 HNWS 1 2 3 6 1 2 3 4 54. A Few Questions About the Graphs (on the preceding page) a. On your velocity vs. time graph, place a "mark" where the v(t) is a maximum. At that specific time, what is happening on the graph of s(t)? Note: This answer is NOT "increasing" or "positive". b. When the walker is speeding up, what is true about distance function s(t)? s(t) is (Again, this answer is NOT "increasing" or "positive".) 5. Finding (and Using) the Velocity Function The velocity data is the data we want to work with! The scatterplot appears to produce a pattern that can be modeled by a quadratic function, so we will attempt to find the "best fitting" velocity function v(t) in the form: v(t) = at + bt + c So, perform a quadratic regression on your calculator. Record the equation below, with the values of a, b, and c, rounded to 3 decimal places. v(t)= Enter this function into Yl of your calculator and graph it. Hopefully it fits the data pretty well! Using the function v(t), determine the time when the walker's velocity was a maximum? What was this maximum. speed? Note: This should be answered analytically, not using your graph. So, show your work! (Round these answers to 2 decimal places.) Time: secs Maximum speed: ft/sec 6. Using the Velocity Function to Calculate the Total Distance Walked The total distance traveled by the walker can be calculated by finding the area of the region under the velocity function and above the t (time) axis. We can approximate this area by dividing the region into rectangular sections and calculating the sum of the areas of the rectangles. (A Right Hand Sum or a Left Hand Sum). Below is the velocity vs. time scatterplot and the velocity function. Our first approximation will be to divide the horizontal (time) axis into 4 equal parts. Since the total time for the data collection was 6 seconds, the width of each of the four rectangles, which we will call Ax , will be second(s). We will use the right endpoint (a right-hand sum) of each subinterval to determine the height of each rectangle. Draw the 4 rectangles on the graph above which will show the rectangles used in calculating a right hand sum
Step by Step Solution
There are 3 Steps involved in it

Get step-by-step solutions from verified subject matter experts