

Question: Calculus Based Physics 2 Lab Figure 2-1, The Sun's spectrum at Earth Expected spectrum of Observed spectrum of energy emitted by Earth, as seen from
Calculus Based Physics 2 Lab
Figure 2-1, The Sun's spectrum at Earth
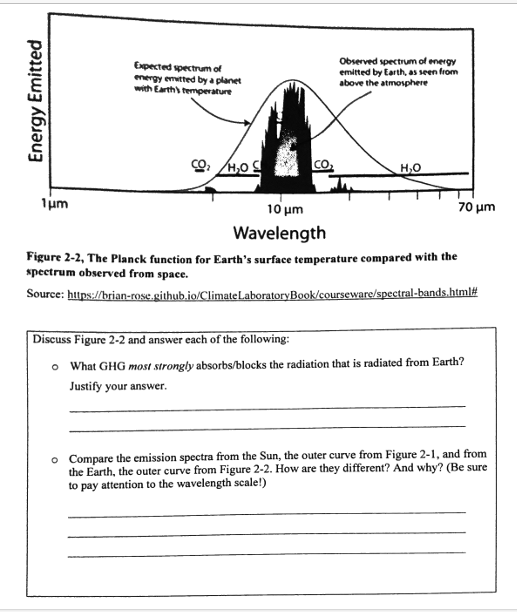
Expected spectrum of Observed spectrum of energy emitted by Earth, as seen from ergy emitted by a planet above the atmosphere with Earth's temperature Energy Emitted CO. /HOS CO, H,O 1 um 10 um 70 um Wavelength Figure 2-2, The Planck function for Earth's surface temperature compared with the spectrum observed from space. Source: hilps://brian-rose.github.in/ClimateLaboratoryBook/courseware/spectral-bands.html# Discuss Figure 2-2 and answer each of the following: o What GHG most strongly absorbs/blocks the radiation that is radiated from Earth? Justify your answer. Compare the emission spectra from the Sun, the outer curve from Figure 2-1, and from the Earth, the outer curve from Figure 2-2. How are they different? And why? (Be sure to pay attention to the wavelength scale!)
Step by Step Solution
There are 3 Steps involved in it

Get step-by-step solutions from verified subject matter experts