

Question: Can anyone answer the 7-2 questions A through H using the chart listed below ? 7-2 The data below are annual total returns for General
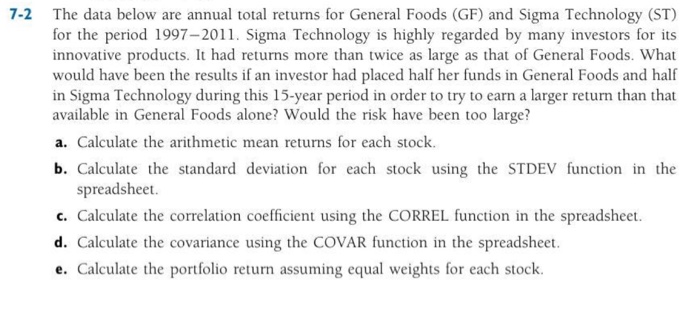
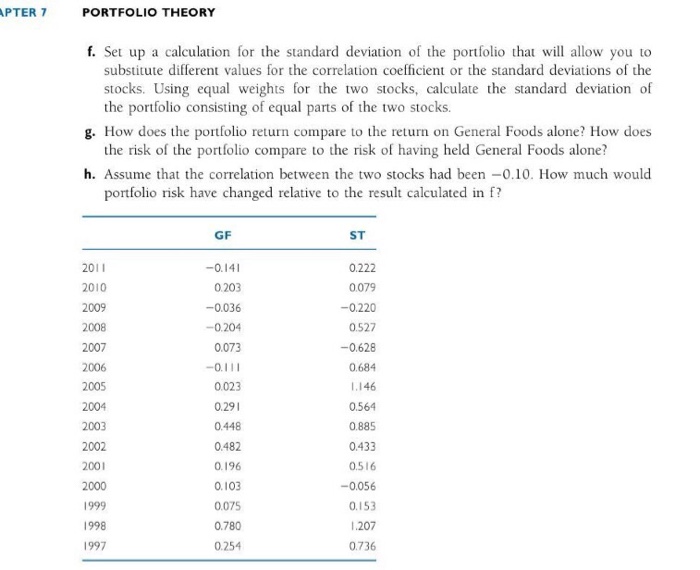
7-2 The data below are annual total returns for General Foods (GF) and Sigma Technology (ST) for the period 1997-2011. Sigma Technology is highly regarded by many investors for its innovative products. It had returns more than twice as large as that of General Foods. What would have been the results if an investor had placed half her funds in General Foods and half in Sigma Technology during this 15-year period in order to try to earn a larger return than that available in General Foods alone? Would the risk have been too large? a. Calculate the arithmetic mean returns for each stock. b. Calculate the standard deviation for each stock using the STDEV function in the spreadsheet. c. Calculate the correlation coefficient using the CORREL function in the spreadsheet. d. Calculate the covariance using the COVAR function in the spreadsheet. e. Calculate the portfolio return assuming equal weights for each stock
Step by Step Solution
There are 3 Steps involved in it

Get step-by-step solutions from verified subject matter experts