

Question: Can anyone answer this question using 4 tables ?? TABLE 1 Idexo's 2016 Income Statement and Balance Sheet 2016 2016 100,000 15,000 20,000 8.219 43,219
Can anyone answer this question using 4 tables ??
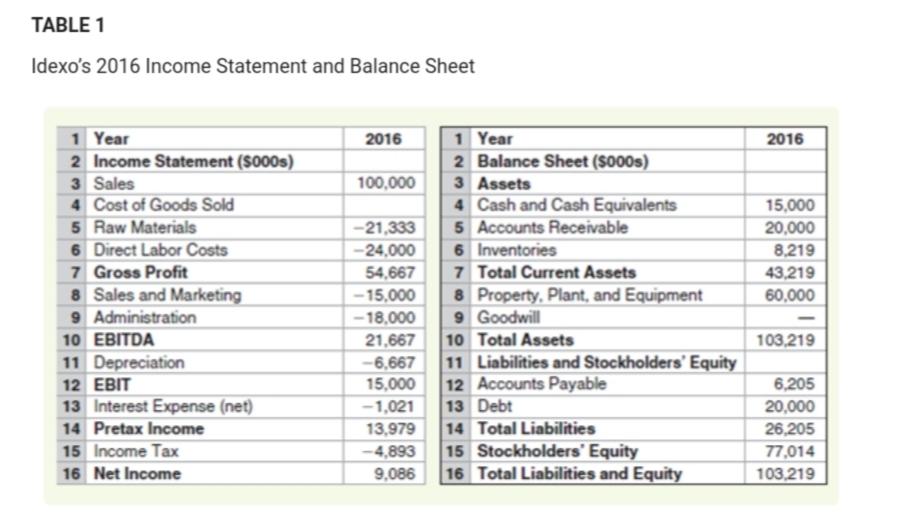
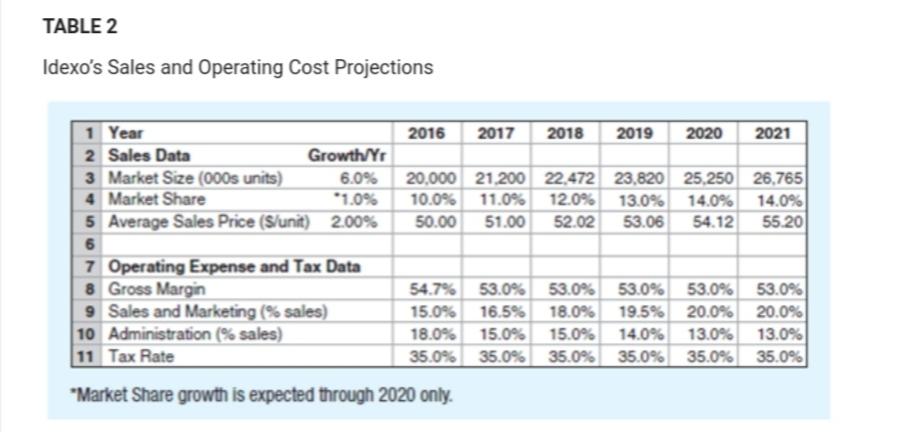
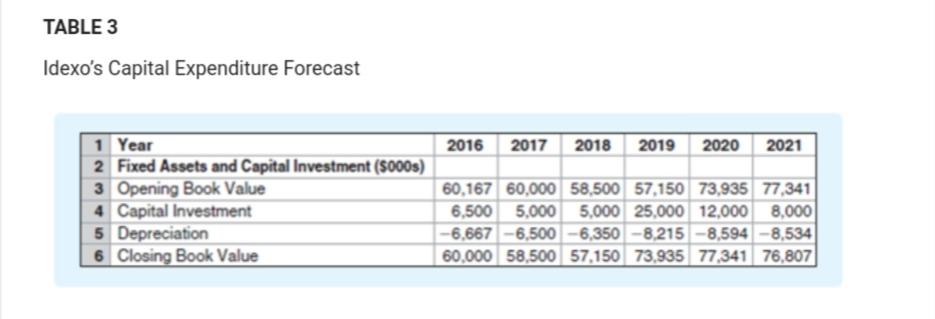
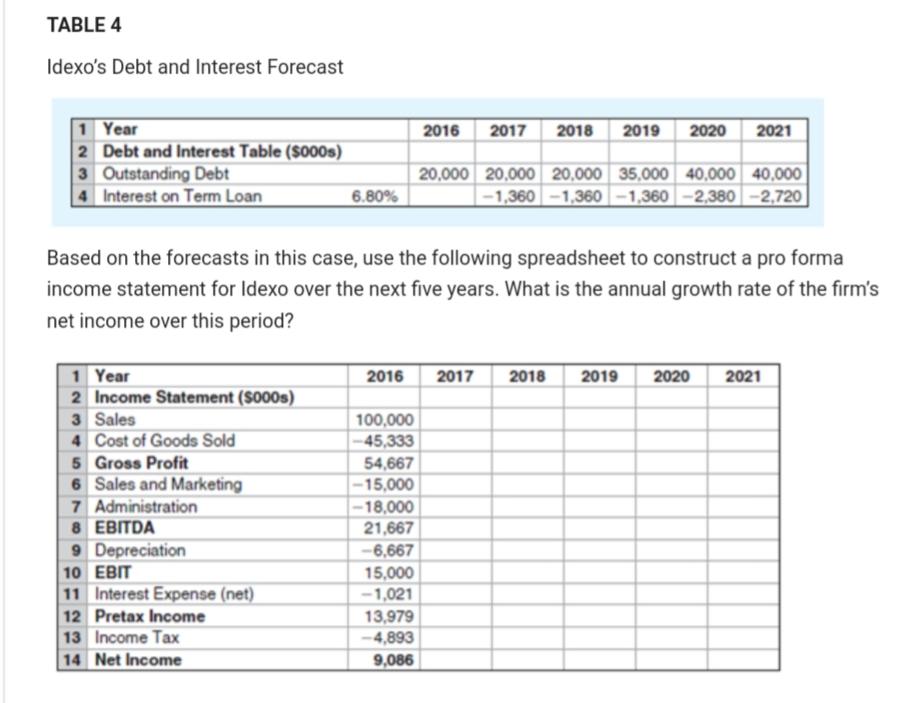
TABLE 1 Idexo's 2016 Income Statement and Balance Sheet 2016 2016 100,000 15,000 20,000 8.219 43,219 60,000 1 Year 2 Income Statement (5000s) 3 Sales 4 Cost of Goods Sold 5 Raw Materials 6 Direct Labor Costs 7 Gross Profit 8 Sales and Marketing 9 Administration 10 EBITDA 11 Depreciation 12 EBIT 13 Interest Expense (net) 14 Pretax Income 15 Income Tax 16 Net Income 1 Year 2 Balance Sheet (5000s) 3 Assets 4 Cash and Cash Equivalents 5 Accounts Receivable 6 Inventories 7 Total Current Assets 8 Property. Plant, and Equipment 9 Goodwill 10 Total Assets 11 Liabilities and Stockholders' Equity 12 Accounts Payable 13 Debt 14 Total Liabilities 15 Stockholders' Equity 16 Total Liabilities and Equity -21,333 - 24,000 54,667 -15,000 -18.000 21,667 -6,667 15,000 -1,021 13,979 -4,893 9,086 103,219 6,205 20,000 26,205 77,014 103,219 TABLE 2 Idexo's Sales and Operating Cost Projections 2016 2017 2018 2019 2020 2021 20.000 21.200 22.472 23,820 25.250 26,765 10.0% 11.0% 12.0% 13.0% 14.0% 14.0% 50.00 51.00 52.02 53.06 54.12 55.20 1 Year 2 Sales Data Growth/Yr 3 Market Size (000s units) 6.0% 4 Market Share *1.0% 5 Average Sales Price (S/unit) 2.00% 6 7 Operating Expense and Tax Data 8 Gross Margin 9 Sales and Marketing (% sales) 10 Administration (% sales) 11 Tax Rate 54.7% 53.0% 53.0% 53.0% 53.0% 53.0% 15.0% 16.5% 18.0% 19.5% 20.0% 20.0% 18.0% 15.0% 15.0% 14.0% 13.0% 13.0% 35.0% 35.0% 35.0% 35.0% 35.0% 35.0% *Market Share growth is expected through 2020 only. TABLE 3 Idexo's Capital Expenditure Forecast 2016 2017 2018 2019 2020 2021 1 Year 2 Fixed Assets and Capital Investment (5000s) 3 Opening Book Value 4 Capital Investment 5 Depreciation 6 Closing Book Value 60,167 60,000 58.500 57,150 73,935 77,341 6,500 5.000 5,000 25.000 12.000 8,000 -6,667 -6,500 -6,350 -8,215 -8,594 -8,534 60.000 58,500 57,150 73,935 77,341 76,807 TABLE4 Idexo's Debt and Interest Forecast 2016 2017 2018 2019 2020 2021 1 Year 2 Debt and Interest Table ($000s) 3 Outstanding Debt 4 Interest on Term Loan 6.80% 20,000 20.000 20.000 35,000 40.000 40.000 -1,360 -1,360 -1,360 -2,380 -2,720 Based on the forecasts in this case, use the following spreadsheet to construct a pro forma income statement for Idexo over the next five years. What is the annual growth rate of the firm's net income over this period? 2016 2017 2018 2019 2020 2021 1 Year 2 Income Statement (5000s) 3 Sales 4 Cost of Goods Sold 5 Gross Profit 6 Sales and Marketing 7 Administration 8 EBITDA 9 Depreciation 10 EBIT 11 Interest Expense (net) 12 Pretax Income 13 Income Tax 14 Net Income 100,000 45,333 54,667 -15,000 - 18.000 21,667 -6,667 15,000 -1,021 13,979 -4,893 9,086 TABLE 1 Idexo's 2016 Income Statement and Balance Sheet 2016 2016 100,000 15,000 20,000 8.219 43,219 60,000 1 Year 2 Income Statement (5000s) 3 Sales 4 Cost of Goods Sold 5 Raw Materials 6 Direct Labor Costs 7 Gross Profit 8 Sales and Marketing 9 Administration 10 EBITDA 11 Depreciation 12 EBIT 13 Interest Expense (net) 14 Pretax Income 15 Income Tax 16 Net Income 1 Year 2 Balance Sheet (5000s) 3 Assets 4 Cash and Cash Equivalents 5 Accounts Receivable 6 Inventories 7 Total Current Assets 8 Property. Plant, and Equipment 9 Goodwill 10 Total Assets 11 Liabilities and Stockholders' Equity 12 Accounts Payable 13 Debt 14 Total Liabilities 15 Stockholders' Equity 16 Total Liabilities and Equity -21,333 - 24,000 54,667 -15,000 -18.000 21,667 -6,667 15,000 -1,021 13,979 -4,893 9,086 103,219 6,205 20,000 26,205 77,014 103,219 TABLE 2 Idexo's Sales and Operating Cost Projections 2016 2017 2018 2019 2020 2021 20.000 21.200 22.472 23,820 25.250 26,765 10.0% 11.0% 12.0% 13.0% 14.0% 14.0% 50.00 51.00 52.02 53.06 54.12 55.20 1 Year 2 Sales Data Growth/Yr 3 Market Size (000s units) 6.0% 4 Market Share *1.0% 5 Average Sales Price (S/unit) 2.00% 6 7 Operating Expense and Tax Data 8 Gross Margin 9 Sales and Marketing (% sales) 10 Administration (% sales) 11 Tax Rate 54.7% 53.0% 53.0% 53.0% 53.0% 53.0% 15.0% 16.5% 18.0% 19.5% 20.0% 20.0% 18.0% 15.0% 15.0% 14.0% 13.0% 13.0% 35.0% 35.0% 35.0% 35.0% 35.0% 35.0% *Market Share growth is expected through 2020 only. TABLE 3 Idexo's Capital Expenditure Forecast 2016 2017 2018 2019 2020 2021 1 Year 2 Fixed Assets and Capital Investment (5000s) 3 Opening Book Value 4 Capital Investment 5 Depreciation 6 Closing Book Value 60,167 60,000 58.500 57,150 73,935 77,341 6,500 5.000 5,000 25.000 12.000 8,000 -6,667 -6,500 -6,350 -8,215 -8,594 -8,534 60.000 58,500 57,150 73,935 77,341 76,807 TABLE4 Idexo's Debt and Interest Forecast 2016 2017 2018 2019 2020 2021 1 Year 2 Debt and Interest Table ($000s) 3 Outstanding Debt 4 Interest on Term Loan 6.80% 20,000 20.000 20.000 35,000 40.000 40.000 -1,360 -1,360 -1,360 -2,380 -2,720 Based on the forecasts in this case, use the following spreadsheet to construct a pro forma income statement for Idexo over the next five years. What is the annual growth rate of the firm's net income over this period? 2016 2017 2018 2019 2020 2021 1 Year 2 Income Statement (5000s) 3 Sales 4 Cost of Goods Sold 5 Gross Profit 6 Sales and Marketing 7 Administration 8 EBITDA 9 Depreciation 10 EBIT 11 Interest Expense (net) 12 Pretax Income 13 Income Tax 14 Net Income 100,000 45,333 54,667 -15,000 - 18.000 21,667 -6,667 15,000 -1,021 13,979 -4,893 9,086
Step by Step Solution
There are 3 Steps involved in it

Get step-by-step solutions from verified subject matter experts