

Question: Can anyone assist in explaining the differences in these two histograms? (From last year's final) A box contains 10,000 tickets with different numbers printed on
Can anyone assist in explaining the differences in these two histograms?
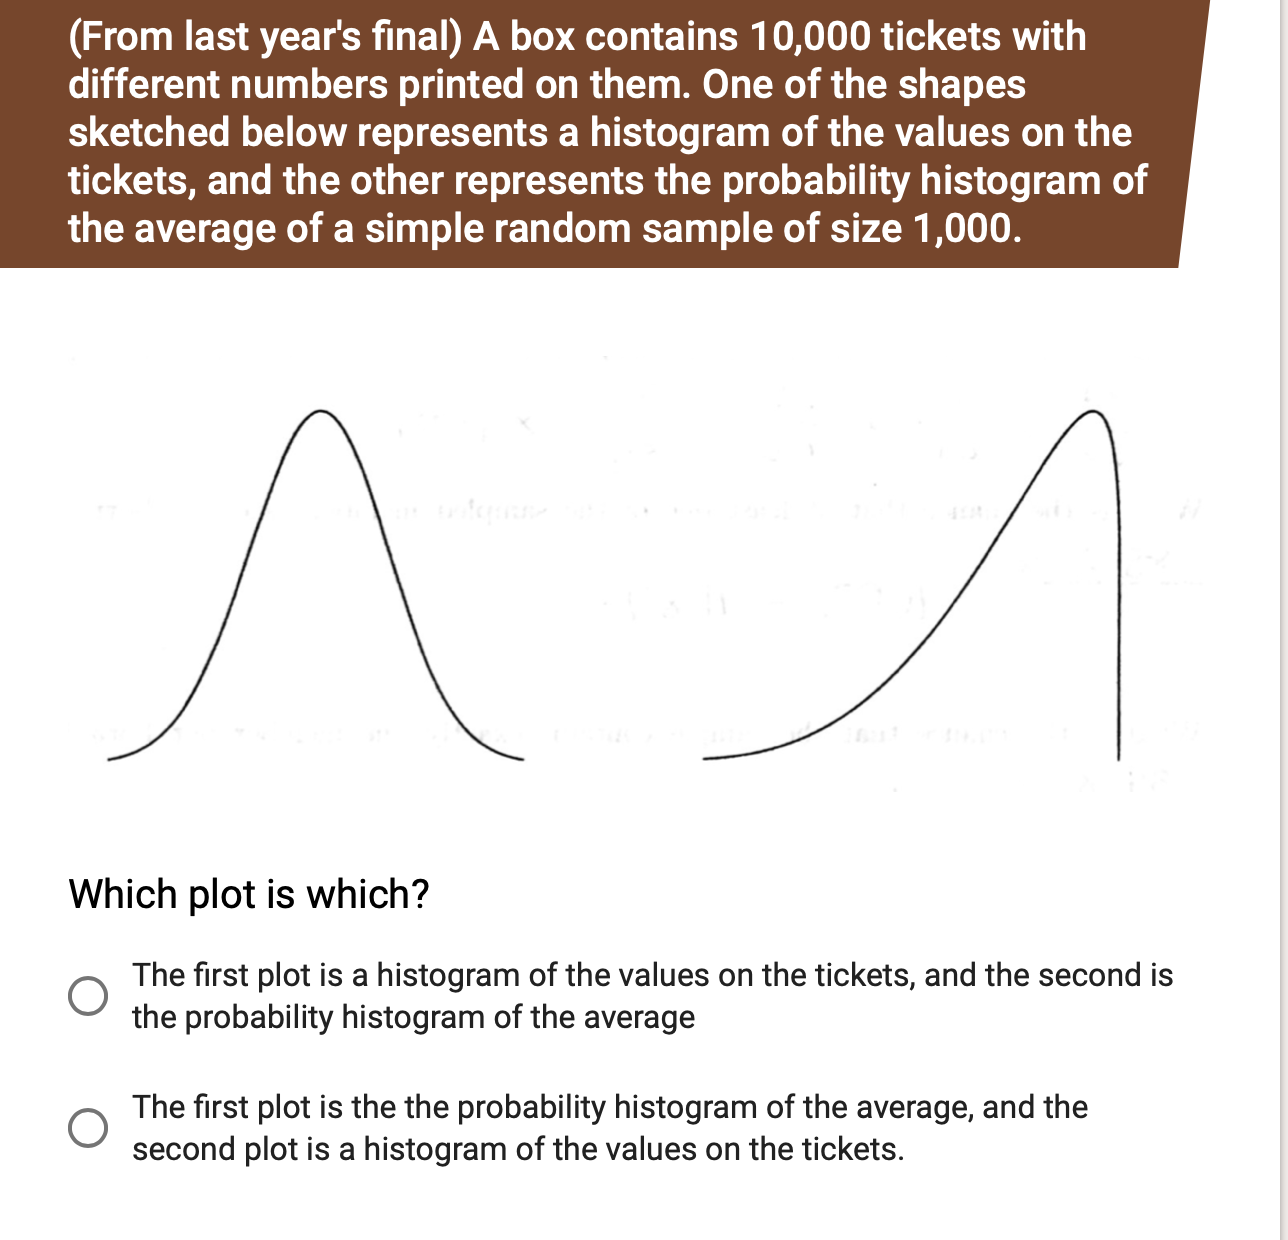
(From last year's final) A box contains 10,000 tickets with different numbers printed on them. One of the shapes sketched below represents a histogram of the values on the tickets, and the other represents the probability histogram of the average of a simple random sample of size 1,000. Which plot is which? 0 The rst plot is a histogram of the values on the tickets, and the second is the probability histogram of the average 0 The rst plot is the the probability histogram of the average, and the second plot is a histogram of the values on the tickets
Step by Step Solution
There are 3 Steps involved in it
1 Expert Approved Answer
Step: 1 Unlock

Question Has Been Solved by an Expert!
Get step-by-step solutions from verified subject matter experts
Step: 2 Unlock
Step: 3 Unlock