

Question: can anyone explain or help? Write in full sentences and enumerate Q. 5 Conduct an unweighted competitive strength assessment for Mattel and its main rivals
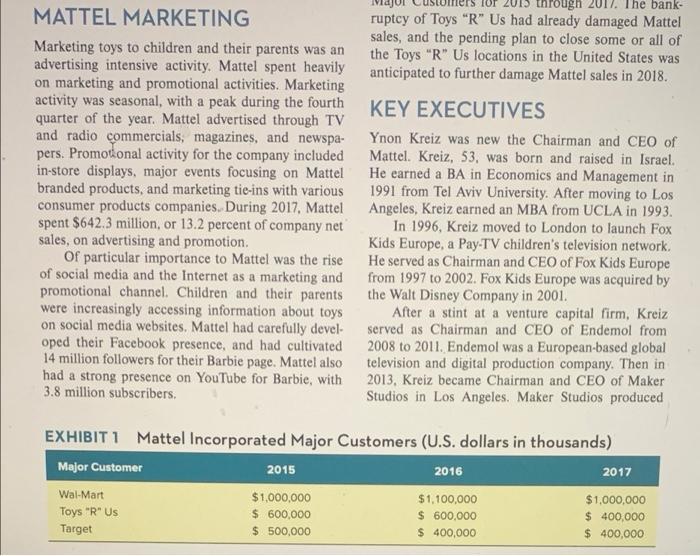
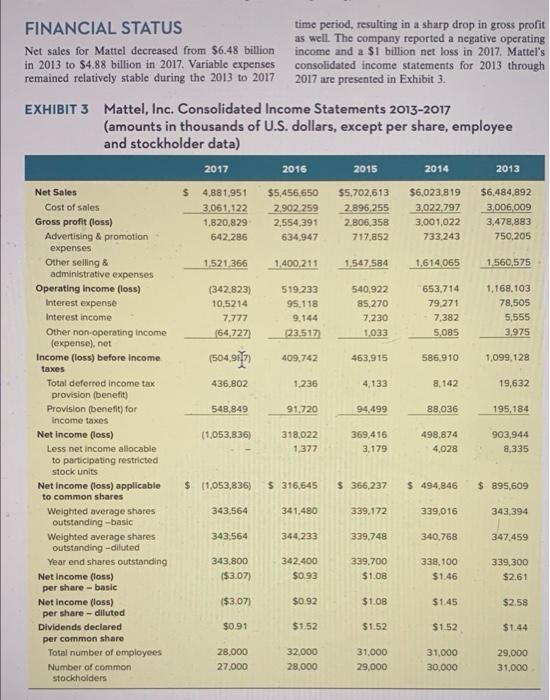
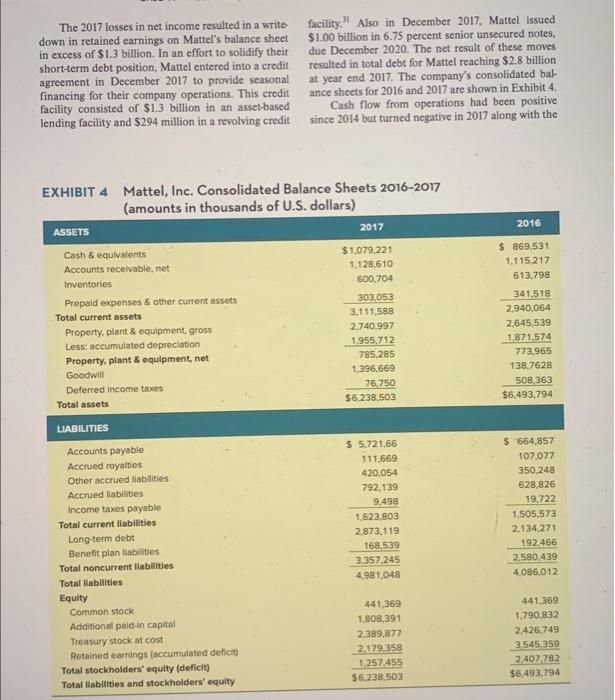
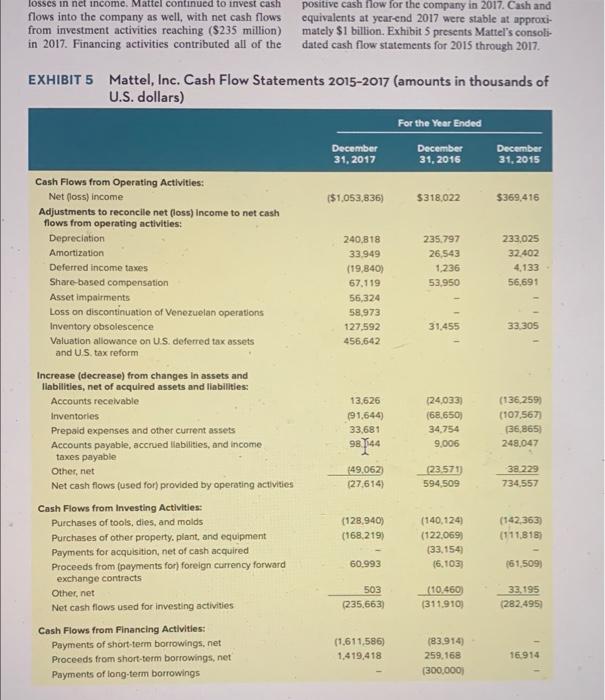
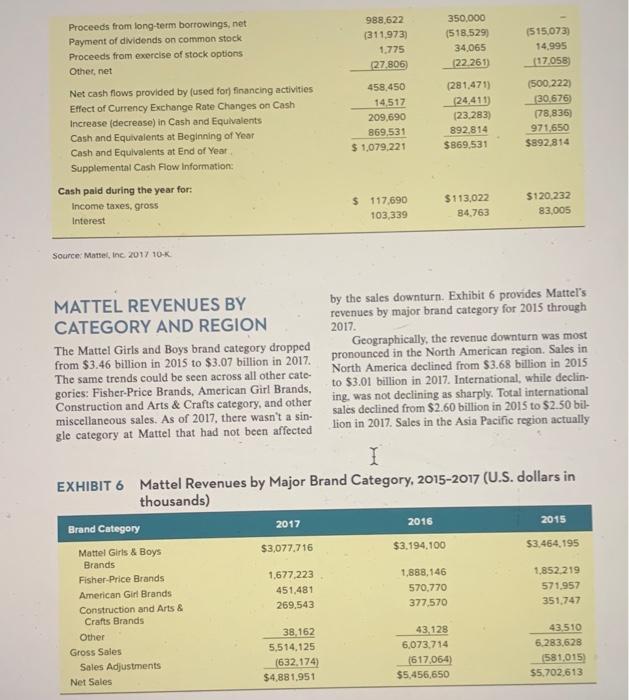
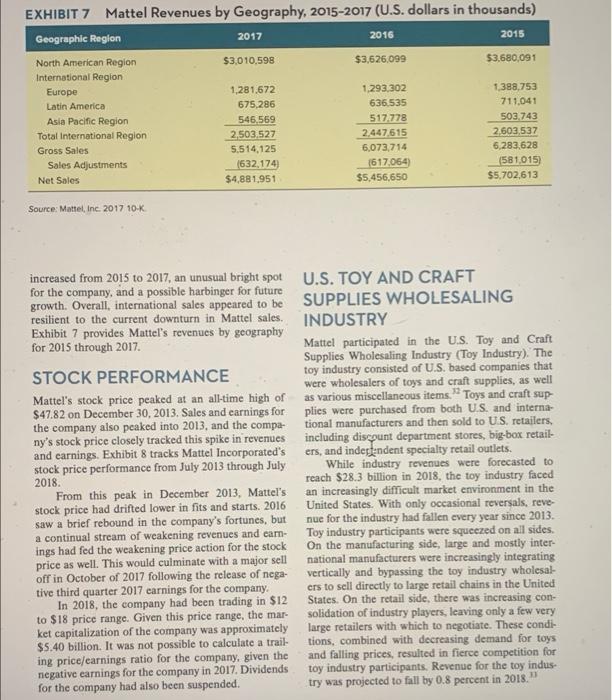
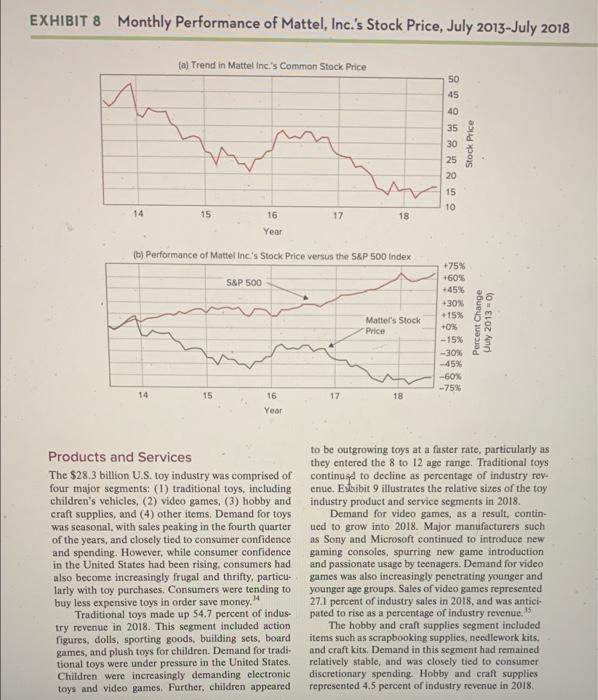
Write in full sentences and enumerate Q. 5 Conduct an unweighted competitive strength assessment for Mattel and its main rivals using the information provided in the case. Explain why you picked the key success factors you did. Conduct a weighted competitive strength assessment for Mattel and its main rivals. Explain why you decided on the weights for the key success factors as you did. Finish with a conclusion paragraph that summarizes your inference or take-away from the analysis you conducted (what do you want the reader to learn from what you did). For this question, you may use EXCEL, if you want. Q. 6 Conduct a financial analysis for the company for 2017, 2016, and 2015 using the following financial ratios: current ratio, return on equity, return on asset, gross profit margin, operating profit margin, net profit margin, and debt-to-asset ratio. Tabulate your results. Explain in words what inferences you draw from this analysis. (Please show your work, not just the final answer. Don't forget what I said in class about unnecessary numbers after the decimal point. If some ratios cannot be calculated, feel free to say so). Major 2017. The bank- MATTEL MARKETING ruptcy of Toys"R" Us had already damaged Mattel sales, and the pending plan to close some or all of Marketing toys to children and their parents was an the Toys"R" Us locations in the United States was advertising intensive activity. Mattel spent heavily anticipated to further damage Mattel sales in 2018. on marketing and promotional activities. Marketing activity was seasonal, with a peak during the fourth KEY EXECUTIVES quarter of the year. Mattel advertised through TV and radio commercials, magazines, and newspa- Ynon Kreiz was new the Chairman and CEO of pers. Promotional activity for the company included Mattel. Kreiz, 53, was born and raised in Israel. in-store displays, major events focusing on Mattel He earned a BA in Economics and Management in branded products, and marketing tie-ins with various 1991 from Tel Aviv University. After moving to Los consumer products companies. During 2017, Mattel Angeles, Kreiz earned an MBA from UCLA in 1993. spent $642.3 million, or 13.2 percent of company net In 1996, Kreiz moved to London to launch Fox sales, on advertising and promotion Kids Europe, a Pay-TV children's television network. Of particular importance to Mattel was the rise He served as Chairman and CEO of Fox Kids Europe of social media and the Internet as a marketing and from 1997 to 2002. Fox Kids Europe was acquired by promotional channel. Children and their parents the Walt Disney Company in 2001. were increasingly accessing information about toys After a stint at a venture capital firm, Kreiz on social media websites. Mattel had carefully devel- served as Chairman and CEO of Endemol from oped their Facebook presence, and had cultivated 2008 to 2011. Endemol was a European-based global 14 million followers for their Barbie page. Mattel also television and digital production company. Then in had a strong presence on YouTube for Barbie, with 2013. Kreiz became Chairman and CEO of Maker 3.8 million subscribers. Studios in Los Angeles. Maker Studios produced EXHIBITI Mattel Incorporated Major Customers (U.S. dollars in thousands) Major Customer 2015 2016 2017 Wal-Mart $1,000,000 $1,100,000 $1,000,000 Toys"R"US $ 600,000 $ 600,000 $ 400,000 Target $ 500,000 $ 400,000 $ 400,000 FINANCIAL STATUS time period, resulting in a sharp drop in gross profit as well. The company reported a negative operating Net sales for Mattel decreased from $6.48 billion income and a $1 billion net loss in 2017. Mattel's in 2013 to $4.88 billion in 2017. Variable expenses consolidated income statements for 2013 through remained relatively stable during the 2013 to 2017 2017 are presented in Exhibit 3. EXHIBIT 3 Mattel, Inc. Consolidated Income Statements 2013-2017 (amounts in thousands of U.S. dollars, except per share, employee and stockholder data) 2017 2016 2015 2014 2013 $ 4,881,951 3,061,122 1.820.829 642286 $5,456,650 2.902 259 2,554,391 534.947 $5.702,613 2.896 255 2.806.358 717.852 $6,023,819 3.022.797 3.001,022 733.243 $6,484,892 3,006,009 3,478,883 750.205 1,521,366 1.400,211 1.547,584 1,614065 1,560,575 (342,823) 10,5214 7.777 64.727) 519.233 95.118 9.144 23517 540,922 85,270 7,230 1,033 653,714 79,271 7.382 5.085 1,168,103 78,505 5,555 3,975 (504.9117 409,742 463,915 586.910 1.099,128 436.802 1.236 4,133 8.142 19,632 548.849 91.720 94.499 88,036 195,184 Net Sales Cost of sales Gross profit (loss) Advertising & promotion expenses Other selling & administrative expenses Operating Income (loss) Interest expense Interest income Other non-operating income (expense), net Income (loss) before income taxes Total deferred income tax provision (benefit) Provision (benefit) for Income taxes Net Income foss) Less net income allocable to participating restricted stock units Net Income (loss) applicable to common shares Weighted average shares outstanding-basic Weighted average shares outstanding-diluted Year end shares outstanding Net Income (loss) per share-basic Net income (loss) per share-diluted Dividends deciared per common share Total number of employees Number of common stockholders (1,053,836) 318,022 1,377 369,416 3,179 498,874 4,028 903,944 8,335 $ 11,053,835) $ 316,645 $366,237 $ 494,846 $ 895,609 343,564 341.480 339.172 339,016 343,394 343,564 344 233 339.748 340.768 347,459 343,800 (53.07) 342.400 $0.93 339,700 $1.08 338,100 $1.46 339,300 $261 1$3.07) $0.92 $1.08 $1.45 $2.58 $0.91 $1.52 $1.52 $1.52 $1.44 28.000 27.000 32,000 28,000 31,000 29,000 31,000 30,000 29.000 31.000 The 2017 losses in net income resulted in a write facility." Also in December 2017, Mattel issued down in retained carnings on Mattel's balance sheet $1.00 billion in 6.75 percent senior unsecured notes, in excess of $1.3 billion. In an effort to solidify their due December 2020. The net result of these moves short-term debt position, Mattel entered into a credit resulted in total debt for Mattel reaching $2.8 billion agreement in December 2017 to provide seasonal at year end 2017. The company's consolidated bal- financing for their company operations. This credit ance sheets for 2016 and 2017 are shown in Exhibit 4. facility consisted of $1.3 billion in an asset-based Cash flow from operations had been positive lending facility and $294 million in a revolving credit since 2014 but turned negative in 2017 along with the EXHIBIT 4 Mattel, Inc. Consolidated Balance Sheets 2016-2017 (amounts in thousands of U.S. dollars) 2017 2016 ASSETS Cash & equivalents Accounts receivable, net Inventories Prepaid expenses & other current assets Total current assets Property, plant & equipment, gross Less: accumulated depreciation Property, plant & equipment, net Goodwill Deferred income taxes Total assets $1,079,221 1.128.610 600,704 303,053 3.111.588 2,740,997 1.955,712 785,285 1.396.669 76,750 $6.238,503 $ 869,531 1.115.217 613,798 341,518 2,940,064 2,645,539 1,871,574 773,965 138,7628 508,363 $6,493,794 LIABILITIES Accounts payable Accrued royalties Other accrued liabilities Accrued liabilities Income taxes payable Total current liabilities Long-term debt Benefit plan abilities Total noncurrent liabilities Total liabilities Equity Common stock Additionat paid in capital Treasury stock at cost Retained earnings (accumulated deficit) Total stockholders' equity (deficit) Total liabilities and stockholders' equity $ 5.721.66 111,669 420,054 792,139 9.498 1.623,803 2.873,119 168,539 3.357 245 4.981.048 $ 564,857 107,077 350,248 628,826 19.722 1,505,573 2,134,271 192.466 2.580,439 4,086,012 441,369 1.808.391 2 389.877 2.179,358 1.257,455 $6.238,503 441,369 1,790,832 2,426,749 3.545,359 2.407.782 $6,493,794 losses in net income. Mattel continued to invest cash flows into the company as well, with net cash flows from investment activities reaching ($235 million) in 2017. Financing activities contributed all of the positive cash flow for the company in 2017. Cash and equivalents at year-end 2017 were stable at approxi- mately $1 billion. Exhibit 5 presents Mattel's consoli- dated cash flow statements for 2015 through 2017 EXHIBIT 5 Mattel, Inc. Cash Flow Statements 2015-2017 (amounts in thousands of U.S. dollars) For the Year Ended December 31, 2017 December 31, 2016 December 31, 2015 ($1,053,836) $318,022 $369,416 235.797 26.543 1.236 53,950 233,025 32.402 4,133 56.691 240.818 33.949 (19,840) 67,119 56.324 58,973 127,592 456.542 31.455 33.305 Cash Flows from Operating Activities: Net (loss) income Adjustments to reconcile net (loss) Income to net cash flows from operating activities: Depreciation Amortization Deferred income taxes Share-based compensation Asset impairments Loss on discontinuation of Venezuelan operations Inventory obsolescence Valuation allowance on U.S. deferred tax assets and US tax reform Increase (decrease) from changes in assets and llabilities, net of acquired assets and liabilities: Accounts receivable Inventories Prepaid expenses and other current assets Accounts payable, accrued liabilities, and income taxes payable Othernet Net cash flows (used for provided by operating activities Cash Flows from Investing Activities: Purchases of tools, dies, and molds Purchases of other property, plant, and equipment Payments for acquisition, net of cash acquired Proceeds from (payments for) foreign currency forward exchange contracts Other, net Net cash flows used for investing activities Cash Flows from Financing Activities: Payments of short-term borrowings, net Proceeds from short-term borrowings, net Payments of long-term borrowings 13,626 91,644) 33,681 124.033) (68.650) 34,754 9.006 (136,259) (107,567) (36,865 248.047 98144 149.062 127,614 23.571 594,509 38.229 734.557 (128.940) (168.219) (142,363) (111818) (140,124) (122,069) (33,154 16,103) 60.993 (61,5091 503 (235,663) (10.460 (311910) 33,195 (282.495 (1.611,586) 1.419,418 (83.914) 259,168 (300,000 16.914 988,622 (311.973) 1.775 27.806 350,000 (518.529) 34,065 122.261 1515,073) 14,995 (17.058) Proceeds from long-term borrowings, net Payment of dividends on common stock Proceeds from exercise of stock options Other, net Net cash flows provided by used for financing activities Effect of Currency Exchange Rate Changes on Cash Increase (decrease) in Cash and Equivalents Cash and Equivalents at Beginning of Year Cash and Equivalents at End of Year Supplemental Cash Flow Information: 458 450 14,517 209,690 869,531 $ 1.079.221 (281,471) 24,411 (23.283) 892.814 $869.531 (500,222) 30 676) (78,836) 971,650 $892.814 Cash paid during the year for: Income taxes, gross Interest $ 117,690 103,339 $113,022 34.763 $120.232 83,005 Source: Matteline 2017 10-K MATTEL REVENUES BY by the sales downturn. Exhibit 6 provides Mattel's revenues by major brand category for 2015 through CATEGORY AND REGION 2017. The Mattel Girls and Boys brand category dropped Geographically, the revenue downturn was most from $3.46 billion in 2015 to $3.07 billion in 2017. pronounced in the North American region. Sales in The same trends could be seen across all other cate- North America declined from $3.68 billion in 2015 gories: Fisher-Price Brands, American Girl Brands, to $3.01 billion in 2017. International, while declin- Construction and Arts & Crafts category, and other ing, was not declining as sharply. Total international miscellaneous sales. As of 2017, there wasn't a sin sales declined from $2.60 billion in 2015 to $2.50 bil- gle category at Mattel that had not been affected lion in 2017. Sales in the Asia Pacific region actually I EXHIBIT 6 Mattel Revenues by Major Brand Category, 2015-2017 (U.S. dollars in thousands) Brand Category 2017 2016 2015 Mattel Girls & Boys $3,077.716 $3,194,100 $3.464.195 Brands Fisher-Price Brands 1.677.223 1,888,146 1.852.219 American Girl Brands 451,481 570.770 571.957 Construction and Arts & 269,543 377.570 351.747 Crafts Brands Other 38.162 43,128 43.510 Gross Sales 5,514,125 6,073.714 6.283,628 Sales Adjustments (632.174) (617,064) (581,015) Net Sales $4,881,951 $5,456,650 $5.702,613 EXHIBIT 7 Mattel Revenues by Geography, 2015-2017 (U.S. dollars in thousands) Geographic Region 2017 2016 2015 North American Region $3,010,598 $3,626,099 $3.680,091 International Region Europe 1,281.672 1,293,302 1.388,753 Latin America 675.286 636.535 711.041 Asia Pacific Region 546,569 517.778 503,743 Total International Region 2,503,527 2,447615 2603,537 Gross Sales 5.514,125 6,073,714 6.283,628 Sales Adjustments (632,174 (617,064) (581,015 Net Sales $4,881.951 $5,456,650 $5,702,613 Source: Mattel, Inc. 2017 10% increased from 2015 to 2017, an unusual bright spot U.S. TOY AND CRAFT for the company, and a possible harbinger for future growth. Overall, international sales appeared to be SUPPLIES WHOLESALING resilient to the current downturn in Mattel sales. INDUSTRY Exhibit 7 provides Mattel's revenues by geography for 2015 through 2017. Mattel participated in the U.S. Toy and Craft Supplies Wholesaling Industry (Toy Industry). The STOCK PERFORMANCE toy industry consisted of U.S. based companies that were wholesalers of toys and craft supplies, as well Mattel's stock price peaked at an all-time high of as various miscellancous items." Toys and craft sup $47.82 on December 30, 2013. Sales and carnings for plies were purchased from both U.S. and interna- the company also pcaked into 2013, and the compa tional manufacturers and then sold to U.S. retailers, ny's stock price closely tracked this spike in revenues including discount department stores, big-box retail- and carnings. Exhibit 8 tracks Mattel Incorporated's ers, and independent specialty retail outlets. stock price performance from July 2013 through July While industry revenues were forecasted to 2018. reach $28.3 billion in 2018, the toy industry faced From this peak in December 2013, Mattel's an increasingly difficult market environment in the stock price had drifted lower in fits and starts 2016 United States. With only occasional reversals, reve- saw a brief rebound in the company's fortunes, but nue for the industry had fallen every year since 2013. a continual stream of weakening revenues and car- Toy industry participants were squeezed on all sides. ings had fed the weakening price action for the stock On the manufacturing side, large and mostly inter- price as well. This would culminate with a major sell national manufacturers were increasingly integrating off in October of 2017 following the release of nega- vertically and bypassing the toy industry wholesal- tive third quarter 2017 carnings for the company. crs to sell directly to large retail chains in the United In 2018, the company had been trading in $12 States. On the retail side, there was increasing con- to $18 price range. Given this price range, the mar- solidation of industry players, leaving only a few very ket capitalization of the company was approximately large retailers with which to negotiate. These condi- $5.40 billion. It was not possible to calculate a trail tions, combined with decreasing demand for toys ing price/carnings ratio for the company, given the and falling prices, resulted in fierce competition for negative earnings for the company in 2017. Dividends toy industry participants. Revenue for the toy indus. for the company had also been suspended. try was projected to fall by 0.8 percent in 2018." EXHIBIT 8 Monthly Performance of Mattel, Inc.'s Stock Price, July 2013-July 2018 (a) Trend in Mattel Inc.'s Common Stock Price 50 45 40 35 30 25 20 Stock Price 15 TO 14 15 17 18 16 ear (bj Performance of Mattel Inc's Stock Price versus the S&P 500 Index S&P 500 Mattel's Stock Price +75% +60% +45% +30% -15% +0% -15% -30% 45% -60% -75% Percent Change July 2013-0) 14 15 16 17 18 Year Products and Services The $28.3 billion U.S. toy industry was comprised of four major segments: (1) traditional toys, including children's vehicles, (2) video games, (3) hobby and craft supplies, and (4) other items. Demand for toys was seasonal, with sales peaking in the fourth quarter of the years, and closely tied to consumer confidence and spending. However, while consumer confidence in the United States had been rising, consumers had also become increasingly frugal and thrifty, particu- larly with toy purchases. Consumers were tending to buy less expensive toys in order save money, Traditional toys made up 54.7 percent of indus- try revenue in 2018. This segment included action figures, dolls, sporting goods, building sets, board games, and plush toys for children. Demand for tradi- tional toys were under pressure in the United States, Children were increasingly demanding clectronic toys and video games. Further, children appeared to be outgrowing toys at a faster rate, particularly as they entered the 8 to 12 age range. Traditional toys continued to decline as percentage of industry rev. enue Estibit 9 illustrates the relative sizes of the toy industry product and service segments in 2018. Demand for video games, as a result, contin- ued to grow into 2018. Major manufacturers such as Sony and Microsoft continued to introduce new gaming consoles, spurring new game introduction and passionate usage by teenagers. Demand for video games was also increasingly penetrating younger and younger age groups. Sales of video games represented 27.1 percent of industry sales in 2018, and was antici pated to rise as a percentage of industry revenue. 35 The hobby and craft supplies segment included items such as scrapbooking supplies, needlework kits. and craft kits. Demand in this segment had remained relatively stable, and was closely tied to consumer discretionary spending. Hobby and craft supplies represented 4.5 percent of industry revenue in 2018. Write in full sentences and enumerate Q. 5 Conduct an unweighted competitive strength assessment for Mattel and its main rivals using the information provided in the case. Explain why you picked the key success factors you did. Conduct a weighted competitive strength assessment for Mattel and its main rivals. Explain why you decided on the weights for the key success factors as you did. Finish with a conclusion paragraph that summarizes your inference or take-away from the analysis you conducted (what do you want the reader to learn from what you did). For this question, you may use EXCEL, if you want. Q. 6 Conduct a financial analysis for the company for 2017, 2016, and 2015 using the following financial ratios: current ratio, return on equity, return on asset, gross profit margin, operating profit margin, net profit margin, and debt-to-asset ratio. Tabulate your results. Explain in words what inferences you draw from this analysis. (Please show your work, not just the final answer. Don't forget what I said in class about unnecessary numbers after the decimal point. If some ratios cannot be calculated, feel free to say so). Major 2017. The bank- MATTEL MARKETING ruptcy of Toys"R" Us had already damaged Mattel sales, and the pending plan to close some or all of Marketing toys to children and their parents was an the Toys"R" Us locations in the United States was advertising intensive activity. Mattel spent heavily anticipated to further damage Mattel sales in 2018. on marketing and promotional activities. Marketing activity was seasonal, with a peak during the fourth KEY EXECUTIVES quarter of the year. Mattel advertised through TV and radio commercials, magazines, and newspa- Ynon Kreiz was new the Chairman and CEO of pers. Promotional activity for the company included Mattel. Kreiz, 53, was born and raised in Israel. in-store displays, major events focusing on Mattel He earned a BA in Economics and Management in branded products, and marketing tie-ins with various 1991 from Tel Aviv University. After moving to Los consumer products companies. During 2017, Mattel Angeles, Kreiz earned an MBA from UCLA in 1993. spent $642.3 million, or 13.2 percent of company net In 1996, Kreiz moved to London to launch Fox sales, on advertising and promotion Kids Europe, a Pay-TV children's television network. Of particular importance to Mattel was the rise He served as Chairman and CEO of Fox Kids Europe of social media and the Internet as a marketing and from 1997 to 2002. Fox Kids Europe was acquired by promotional channel. Children and their parents the Walt Disney Company in 2001. were increasingly accessing information about toys After a stint at a venture capital firm, Kreiz on social media websites. Mattel had carefully devel- served as Chairman and CEO of Endemol from oped their Facebook presence, and had cultivated 2008 to 2011. Endemol was a European-based global 14 million followers for their Barbie page. Mattel also television and digital production company. Then in had a strong presence on YouTube for Barbie, with 2013. Kreiz became Chairman and CEO of Maker 3.8 million subscribers. Studios in Los Angeles. Maker Studios produced EXHIBITI Mattel Incorporated Major Customers (U.S. dollars in thousands) Major Customer 2015 2016 2017 Wal-Mart $1,000,000 $1,100,000 $1,000,000 Toys"R"US $ 600,000 $ 600,000 $ 400,000 Target $ 500,000 $ 400,000 $ 400,000 FINANCIAL STATUS time period, resulting in a sharp drop in gross profit as well. The company reported a negative operating Net sales for Mattel decreased from $6.48 billion income and a $1 billion net loss in 2017. Mattel's in 2013 to $4.88 billion in 2017. Variable expenses consolidated income statements for 2013 through remained relatively stable during the 2013 to 2017 2017 are presented in Exhibit 3. EXHIBIT 3 Mattel, Inc. Consolidated Income Statements 2013-2017 (amounts in thousands of U.S. dollars, except per share, employee and stockholder data) 2017 2016 2015 2014 2013 $ 4,881,951 3,061,122 1.820.829 642286 $5,456,650 2.902 259 2,554,391 534.947 $5.702,613 2.896 255 2.806.358 717.852 $6,023,819 3.022.797 3.001,022 733.243 $6,484,892 3,006,009 3,478,883 750.205 1,521,366 1.400,211 1.547,584 1,614065 1,560,575 (342,823) 10,5214 7.777 64.727) 519.233 95.118 9.144 23517 540,922 85,270 7,230 1,033 653,714 79,271 7.382 5.085 1,168,103 78,505 5,555 3,975 (504.9117 409,742 463,915 586.910 1.099,128 436.802 1.236 4,133 8.142 19,632 548.849 91.720 94.499 88,036 195,184 Net Sales Cost of sales Gross profit (loss) Advertising & promotion expenses Other selling & administrative expenses Operating Income (loss) Interest expense Interest income Other non-operating income (expense), net Income (loss) before income taxes Total deferred income tax provision (benefit) Provision (benefit) for Income taxes Net Income foss) Less net income allocable to participating restricted stock units Net Income (loss) applicable to common shares Weighted average shares outstanding-basic Weighted average shares outstanding-diluted Year end shares outstanding Net Income (loss) per share-basic Net income (loss) per share-diluted Dividends deciared per common share Total number of employees Number of common stockholders (1,053,836) 318,022 1,377 369,416 3,179 498,874 4,028 903,944 8,335 $ 11,053,835) $ 316,645 $366,237 $ 494,846 $ 895,609 343,564 341.480 339.172 339,016 343,394 343,564 344 233 339.748 340.768 347,459 343,800 (53.07) 342.400 $0.93 339,700 $1.08 338,100 $1.46 339,300 $261 1$3.07) $0.92 $1.08 $1.45 $2.58 $0.91 $1.52 $1.52 $1.52 $1.44 28.000 27.000 32,000 28,000 31,000 29,000 31,000 30,000 29.000 31.000 The 2017 losses in net income resulted in a write facility." Also in December 2017, Mattel issued down in retained carnings on Mattel's balance sheet $1.00 billion in 6.75 percent senior unsecured notes, in excess of $1.3 billion. In an effort to solidify their due December 2020. The net result of these moves short-term debt position, Mattel entered into a credit resulted in total debt for Mattel reaching $2.8 billion agreement in December 2017 to provide seasonal at year end 2017. The company's consolidated bal- financing for their company operations. This credit ance sheets for 2016 and 2017 are shown in Exhibit 4. facility consisted of $1.3 billion in an asset-based Cash flow from operations had been positive lending facility and $294 million in a revolving credit since 2014 but turned negative in 2017 along with the EXHIBIT 4 Mattel, Inc. Consolidated Balance Sheets 2016-2017 (amounts in thousands of U.S. dollars) 2017 2016 ASSETS Cash & equivalents Accounts receivable, net Inventories Prepaid expenses & other current assets Total current assets Property, plant & equipment, gross Less: accumulated depreciation Property, plant & equipment, net Goodwill Deferred income taxes Total assets $1,079,221 1.128.610 600,704 303,053 3.111.588 2,740,997 1.955,712 785,285 1.396.669 76,750 $6.238,503 $ 869,531 1.115.217 613,798 341,518 2,940,064 2,645,539 1,871,574 773,965 138,7628 508,363 $6,493,794 LIABILITIES Accounts payable Accrued royalties Other accrued liabilities Accrued liabilities Income taxes payable Total current liabilities Long-term debt Benefit plan abilities Total noncurrent liabilities Total liabilities Equity Common stock Additionat paid in capital Treasury stock at cost Retained earnings (accumulated deficit) Total stockholders' equity (deficit) Total liabilities and stockholders' equity $ 5.721.66 111,669 420,054 792,139 9.498 1.623,803 2.873,119 168,539 3.357 245 4.981.048 $ 564,857 107,077 350,248 628,826 19.722 1,505,573 2,134,271 192.466 2.580,439 4,086,012 441,369 1.808.391 2 389.877 2.179,358 1.257,455 $6.238,503 441,369 1,790,832 2,426,749 3.545,359 2.407.782 $6,493,794 losses in net income. Mattel continued to invest cash flows into the company as well, with net cash flows from investment activities reaching ($235 million) in 2017. Financing activities contributed all of the positive cash flow for the company in 2017. Cash and equivalents at year-end 2017 were stable at approxi- mately $1 billion. Exhibit 5 presents Mattel's consoli- dated cash flow statements for 2015 through 2017 EXHIBIT 5 Mattel, Inc. Cash Flow Statements 2015-2017 (amounts in thousands of U.S. dollars) For the Year Ended December 31, 2017 December 31, 2016 December 31, 2015 ($1,053,836) $318,022 $369,416 235.797 26.543 1.236 53,950 233,025 32.402 4,133 56.691 240.818 33.949 (19,840) 67,119 56.324 58,973 127,592 456.542 31.455 33.305 Cash Flows from Operating Activities: Net (loss) income Adjustments to reconcile net (loss) Income to net cash flows from operating activities: Depreciation Amortization Deferred income taxes Share-based compensation Asset impairments Loss on discontinuation of Venezuelan operations Inventory obsolescence Valuation allowance on U.S. deferred tax assets and US tax reform Increase (decrease) from changes in assets and llabilities, net of acquired assets and liabilities: Accounts receivable Inventories Prepaid expenses and other current assets Accounts payable, accrued liabilities, and income taxes payable Othernet Net cash flows (used for provided by operating activities Cash Flows from Investing Activities: Purchases of tools, dies, and molds Purchases of other property, plant, and equipment Payments for acquisition, net of cash acquired Proceeds from (payments for) foreign currency forward exchange contracts Other, net Net cash flows used for investing activities Cash Flows from Financing Activities: Payments of short-term borrowings, net Proceeds from short-term borrowings, net Payments of long-term borrowings 13,626 91,644) 33,681 124.033) (68.650) 34,754 9.006 (136,259) (107,567) (36,865 248.047 98144 149.062 127,614 23.571 594,509 38.229 734.557 (128.940) (168.219) (142,363) (111818) (140,124) (122,069) (33,154 16,103) 60.993 (61,5091 503 (235,663) (10.460 (311910) 33,195 (282.495 (1.611,586) 1.419,418 (83.914) 259,168 (300,000 16.914 988,622 (311.973) 1.775 27.806 350,000 (518.529) 34,065 122.261 1515,073) 14,995 (17.058) Proceeds from long-term borrowings, net Payment of dividends on common stock Proceeds from exercise of stock options Other, net Net cash flows provided by used for financing activities Effect of Currency Exchange Rate Changes on Cash Increase (decrease) in Cash and Equivalents Cash and Equivalents at Beginning of Year Cash and Equivalents at End of Year Supplemental Cash Flow Information: 458 450 14,517 209,690 869,531 $ 1.079.221 (281,471) 24,411 (23.283) 892.814 $869.531 (500,222) 30 676) (78,836) 971,650 $892.814 Cash paid during the year for: Income taxes, gross Interest $ 117,690 103,339 $113,022 34.763 $120.232 83,005 Source: Matteline 2017 10-K MATTEL REVENUES BY by the sales downturn. Exhibit 6 provides Mattel's revenues by major brand category for 2015 through CATEGORY AND REGION 2017. The Mattel Girls and Boys brand category dropped Geographically, the revenue downturn was most from $3.46 billion in 2015 to $3.07 billion in 2017. pronounced in the North American region. Sales in The same trends could be seen across all other cate- North America declined from $3.68 billion in 2015 gories: Fisher-Price Brands, American Girl Brands, to $3.01 billion in 2017. International, while declin- Construction and Arts & Crafts category, and other ing, was not declining as sharply. Total international miscellaneous sales. As of 2017, there wasn't a sin sales declined from $2.60 billion in 2015 to $2.50 bil- gle category at Mattel that had not been affected lion in 2017. Sales in the Asia Pacific region actually I EXHIBIT 6 Mattel Revenues by Major Brand Category, 2015-2017 (U.S. dollars in thousands) Brand Category 2017 2016 2015 Mattel Girls & Boys $3,077.716 $3,194,100 $3.464.195 Brands Fisher-Price Brands 1.677.223 1,888,146 1.852.219 American Girl Brands 451,481 570.770 571.957 Construction and Arts & 269,543 377.570 351.747 Crafts Brands Other 38.162 43,128 43.510 Gross Sales 5,514,125 6,073.714 6.283,628 Sales Adjustments (632.174) (617,064) (581,015) Net Sales $4,881,951 $5,456,650 $5.702,613 EXHIBIT 7 Mattel Revenues by Geography, 2015-2017 (U.S. dollars in thousands) Geographic Region 2017 2016 2015 North American Region $3,010,598 $3,626,099 $3.680,091 International Region Europe 1,281.672 1,293,302 1.388,753 Latin America 675.286 636.535 711.041 Asia Pacific Region 546,569 517.778 503,743 Total International Region 2,503,527 2,447615 2603,537 Gross Sales 5.514,125 6,073,714 6.283,628 Sales Adjustments (632,174 (617,064) (581,015 Net Sales $4,881.951 $5,456,650 $5,702,613 Source: Mattel, Inc. 2017 10% increased from 2015 to 2017, an unusual bright spot U.S. TOY AND CRAFT for the company, and a possible harbinger for future growth. Overall, international sales appeared to be SUPPLIES WHOLESALING resilient to the current downturn in Mattel sales. INDUSTRY Exhibit 7 provides Mattel's revenues by geography for 2015 through 2017. Mattel participated in the U.S. Toy and Craft Supplies Wholesaling Industry (Toy Industry). The STOCK PERFORMANCE toy industry consisted of U.S. based companies that were wholesalers of toys and craft supplies, as well Mattel's stock price peaked at an all-time high of as various miscellancous items." Toys and craft sup $47.82 on December 30, 2013. Sales and carnings for plies were purchased from both U.S. and interna- the company also pcaked into 2013, and the compa tional manufacturers and then sold to U.S. retailers, ny's stock price closely tracked this spike in revenues including discount department stores, big-box retail- and carnings. Exhibit 8 tracks Mattel Incorporated's ers, and independent specialty retail outlets. stock price performance from July 2013 through July While industry revenues were forecasted to 2018. reach $28.3 billion in 2018, the toy industry faced From this peak in December 2013, Mattel's an increasingly difficult market environment in the stock price had drifted lower in fits and starts 2016 United States. With only occasional reversals, reve- saw a brief rebound in the company's fortunes, but nue for the industry had fallen every year since 2013. a continual stream of weakening revenues and car- Toy industry participants were squeezed on all sides. ings had fed the weakening price action for the stock On the manufacturing side, large and mostly inter- price as well. This would culminate with a major sell national manufacturers were increasingly integrating off in October of 2017 following the release of nega- vertically and bypassing the toy industry wholesal- tive third quarter 2017 carnings for the company. crs to sell directly to large retail chains in the United In 2018, the company had been trading in $12 States. On the retail side, there was increasing con- to $18 price range. Given this price range, the mar- solidation of industry players, leaving only a few very ket capitalization of the company was approximately large retailers with which to negotiate. These condi- $5.40 billion. It was not possible to calculate a trail tions, combined with decreasing demand for toys ing price/carnings ratio for the company, given the and falling prices, resulted in fierce competition for negative earnings for the company in 2017. Dividends toy industry participants. Revenue for the toy indus. for the company had also been suspended. try was projected to fall by 0.8 percent in 2018." EXHIBIT 8 Monthly Performance of Mattel, Inc.'s Stock Price, July 2013-July 2018 (a) Trend in Mattel Inc.'s Common Stock Price 50 45 40 35 30 25 20 Stock Price 15 TO 14 15 17 18 16 ear (bj Performance of Mattel Inc's Stock Price versus the S&P 500 Index S&P 500 Mattel's Stock Price +75% +60% +45% +30% -15% +0% -15% -30% 45% -60% -75% Percent Change July 2013-0) 14 15 16 17 18 Year Products and Services The $28.3 billion U.S. toy industry was comprised of four major segments: (1) traditional toys, including children's vehicles, (2) video games, (3) hobby and craft supplies, and (4) other items. Demand for toys was seasonal, with sales peaking in the fourth quarter of the years, and closely tied to consumer confidence and spending. However, while consumer confidence in the United States had been rising, consumers had also become increasingly frugal and thrifty, particu- larly with toy purchases. Consumers were tending to buy less expensive toys in order save money, Traditional toys made up 54.7 percent of indus- try revenue in 2018. This segment included action figures, dolls, sporting goods, building sets, board games, and plush toys for children. Demand for tradi- tional toys were under pressure in the United States, Children were increasingly demanding clectronic toys and video games. Further, children appeared to be outgrowing toys at a faster rate, particularly as they entered the 8 to 12 age range. Traditional toys continued to decline as percentage of industry rev. enue Estibit 9 illustrates the relative sizes of the toy industry product and service segments in 2018. Demand for video games, as a result, contin- ued to grow into 2018. Major manufacturers such as Sony and Microsoft continued to introduce new gaming consoles, spurring new game introduction and passionate usage by teenagers. Demand for video games was also increasingly penetrating younger and younger age groups. Sales of video games represented 27.1 percent of industry sales in 2018, and was antici pated to rise as a percentage of industry revenue. 35 The hobby and craft supplies segment included items such as scrapbooking supplies, needlework kits. and craft kits. Demand in this segment had remained relatively stable, and was closely tied to consumer discretionary spending. Hobby and craft supplies represented 4.5 percent of industry revenue in 2018
Step by Step Solution
There are 3 Steps involved in it

Get step-by-step solutions from verified subject matter experts