

Question: Can anyone help me change the code below to make a plot.... import numpy Pressure_Gpa=[0.1,0.15,0.25,0.27,0.5,0.75,1,1.25,1.5,1.75,2,2.25,2.5,2.75,2.8, 2.85,2.9,3,3.5,4,4.25,4.5,4.6,4.61] TemperatureTtoC_k=numpy.array([662,666,644,641,583,554,524,494,464,433,403,372, 341,335,329,322,310,246,178,140,92,59,51]) TemperatureOtoT_k=numpy.array([450,444,432,420,401,371,340,300,277,244,211,176, 133,90,75,50]) TemperatureRtoO_k=[104,93,59,31] import matplotlib.pyplot as plt
Can anyone help me change the code below to make a plot....
import numpy
Pressure_Gpa=[0.1,0.15,0.25,0.27,0.5,0.75,1,1.25,1.5,1.75,2,2.25,2.5,2.75,2.8, 2.85,2.9,3,3.5,4,4.25,4.5,4.6,4.61]
TemperatureTtoC_k=numpy.array([662,666,644,641,583,554,524,494,464,433,403,372, 341,335,329,322,310,246,178,140,92,59,51])
TemperatureOtoT_k=numpy.array([450,444,432,420,401,371,340,300,277,244,211,176, 133,90,75,50])
TemperatureRtoO_k=[104,93,59,31]
import matplotlib.pyplot as plt plt.plot(Pressure_Gpa, TemperatureRtoO_k, 'ro', label='TemperatureRtoO_k') plt.plot(Pressure_Gpa, TemperatureTtoC_k, 'ro', label='TemperatureTtoC_k') plt.plot(Pressure_Gpa, TemperatureOtoT_k, 'ro', label='TemperatureOtoT_k')
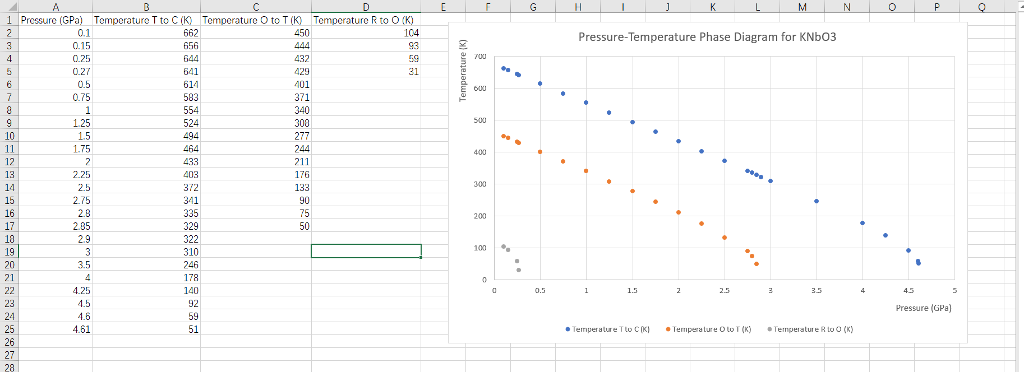
Pressure (GPa) Temperature T to C( Temperature 662 656 to TK Temperature R to O (K) 104 0.15 Pressure-Temperature Phase Diagram for KNbO3 0.27 0.5 0.75 641 6141 101 371 554 524 10 1.5 244 211 176 12 13 14 15 16 433 403 2.75 341 335 75 50 2.85 322 310 246 178 100 21 1.5 1.6 4.61 24 Pressure (GPa) 27 Pressure (GPa) Temperature T to C( Temperature 662 656 to TK Temperature R to O (K) 104 0.15 Pressure-Temperature Phase Diagram for KNbO3 0.27 0.5 0.75 641 6141 101 371 554 524 10 1.5 244 211 176 12 13 14 15 16 433 403 2.75 341 335 75 50 2.85 322 310 246 178 100 21 1.5 1.6 4.61 24 Pressure (GPa) 27
Step by Step Solution
There are 3 Steps involved in it

Get step-by-step solutions from verified subject matter experts