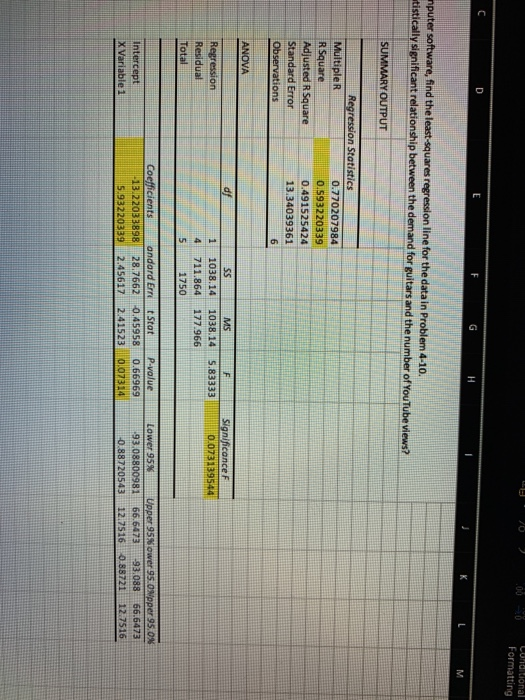
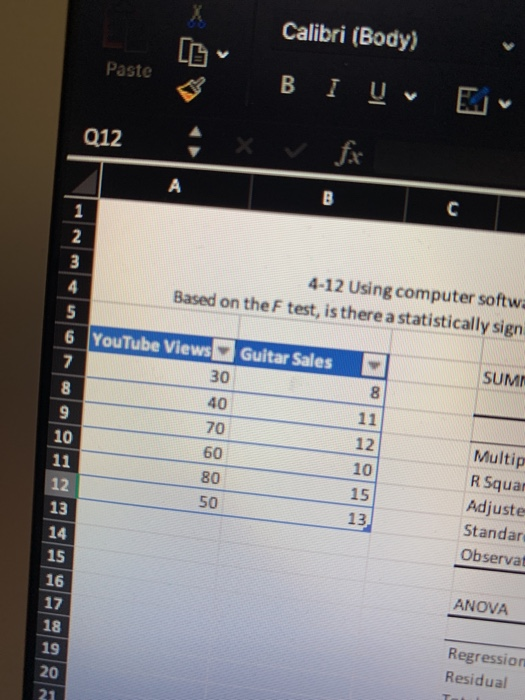
Question: can anyone help me check this out? do I have to fix my Output range? could you explain how could I find the Output Range?

can anyone help me check this out? do I have to
can anyone help me check this out? do I have to fix my Output range? could you explain how could I find the Output Range?
can anyone help me check this out? do I have to
4-12 Using computer software, find the least-squares regression line for the data in Problem 4-10. Based on the F test, is there a statistically significant relationship between the demand for guitars and the number of YouTube views? 4-12 Using computer software, find the least squares regression line for the data in Problem 4-10. Based on the F test, is there a statistically significant relationship between the demand for guitars and the number of YouTube views? SUMMARY OUTPUT YouTube View Guitar Sales 30 40 70 60 80 so 8 11 12 10 15 13 Regression Statistics Multiple 0.770207984 R Square 0.593220339 Adjusted R Square 0.491525424 Standard Error 13.34039361 Observations 6 ANOVA dy Significance F 0.073139544 Regression Residual Total SS MS F 1038.14 1038.14 5.83333 711.864 177.966 1750 1 4 5 Intercept X Variable 1 Coefficients andard Em Stat -13.22033898 28.7662 0.45958 5.93220339 2.45617 2.41523 P-value 0.66969 0.07314 Lower 95% Upper 95% ower 95.0 Mpper 95.0% -93.08800981 66.6473 -93.088 66.6473 -0.88720543 12.7516 0.88721 12.7516 Conditional Formatting D E H M nputer software, find the least-squares regression line for the data in Problem 4-10. tistically significant relationship between the demand for guitars and the number of YouTube views? SUMMARY OUTPUT Regression Statistics Multiple R 0.770207984 R Square 0.593220339 Adjusted R Square 0.491525424 Standard Error 13.34039361 Observations 6 ANOVA df F Significance 0.073139544 Regression Residual Total 5.83333 MS 1038.14 177.966 1 4 5 SS 1038.14 711.864 1750 Intercept X Variable 1 Coefficients andard Erre Stat P-value -13 22033898 28.7662 0.45958 0.66969 5.93220339 2.45617 2.41523 0 07314 Lower 95% Upper 95%ower 95.Opper 95.0% -93,08800981 66.6473 -93.088 66.6473 0.88720543 12.7516 0.88721 12.7516 Calibri (Body) Paste BI U Q12 fx A B C 1 2 3 4-12 Using computer softwa 4 Based on the F test, is there a statistically sign 5 6 YouTube Views Guitar Sales SUM 7 30 8 8 40 11 9 70 Multip 10 10 R Squar 11 80 15 Adjuste 50 13 Standar 13 Observat 14 15 ANOVA 60 12 12 16 17 18 19 20 21 Regression Residual

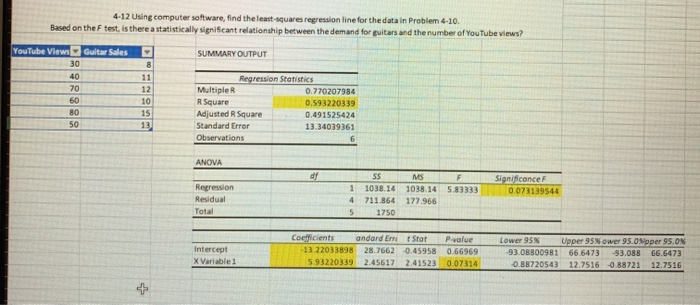
Step by Step Solution

There are 3 Steps involved in it

1 Expert Approved Answer
Step: 1 Unlock blur-text-image
Question Has Been Solved by an Expert!

Get step-by-step solutions from verified subject matter experts

Step: 2 Unlock
Step: 3 Unlock

Students Have Also Explored These Related General Management Questions!