

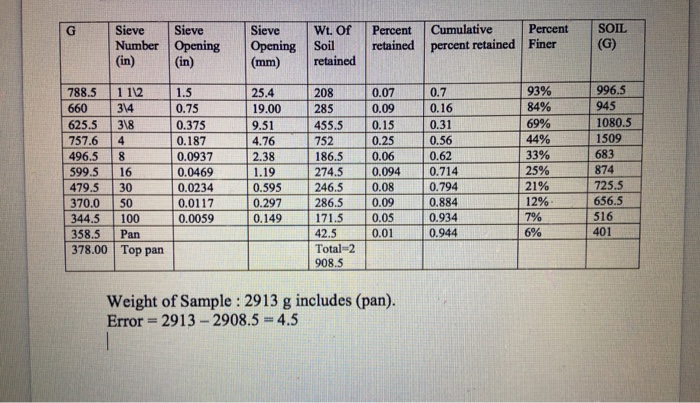
Question: Can anyone help me graph this table in excel. The sieve opening (mm) should be X line Percent finer should be Y line Sieve Wt.
 Can anyone help me graph this table in excel. The sieve opening (mm) should be X line
 Percent finer should be Y line
Sieve Wt. Of Percent cumulative Percent SOIL, Sieve Sieve Number opening Opening soil retained percent retained Finer (G) (in) (in) (mm) retained 788.5 112 1.5 254 208 007 0.7 55% 996.5 660 34 0.75 19.00 285 009 016 84% 945 625.5 38 0.375 9151 4555 015 0.31 69% 1080.5 757.6 4 0.187 4.76 i752 025 0.56 44% 1509 062 33% 683 186.5 0.06 496.5 8 0.0937 2.38 874 599.5 16 0.0469 1.19 274.5 0.094 0.714 25% 2190 656.5 479.5 30 0.0234 370.0 50 0.0117 0.297 286.5 0.09 0.884 7%. 344.5 100 358.5 Pan 378.00 Top pan Total 2 908.5 Weight of Sample 2913 g includes (pan). Error- 2913 2908.5 4.5
Step by Step Solution
There are 3 Steps involved in it
1 Expert Approved Answer
Step: 1 Unlock

Question Has Been Solved by an Expert!
Get step-by-step solutions from verified subject matter experts
Step: 2 Unlock
Step: 3 Unlock