

Question: Can anyone help me with my C homework? Sample Gummel plot data February 16, 2018 @ 10:00am Base-Emitter Voltage Base and Collector Currents VBE IBase
Can anyone help me with my C homework?
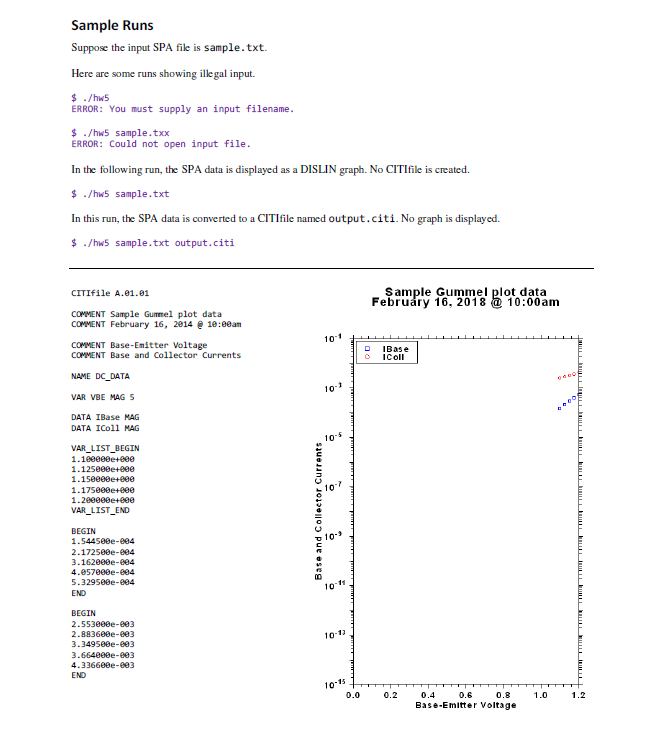
Sample Gummel plot data February 16, 2018 @ 10:00am Base-Emitter Voltage Base and Collector Currents VBE IBase IColl DATA 1.1000e+00 154.45E-06 2.5530E-03 1.1250e+00 217.25E-06 2.8836E-03 1.1500e+00 316.20E-06 3.3495E-03 1.1750e+00 405.70E-06 3.6640E-03 1.2000e+00 532.95E-06 4.3366E-03
Gummel plot for X51C SiGe HBT, T=23C 2003-Jul-4 Applied Base-Emitter Voltage (V) Base & Collector Currents (A) VBE IC IB DATA 0.0000e+00 100.00E-15 -100.00E-15 2.5000e-02 100.00E-15 -150.00E-15 5.0000e-02 150.00E-15 -100.00E-15 7.5000e-02 100.00E-15 -100.00E-15 1.0000e-01 100.00E-15 -100.00E-15 1.2500e-01 100.00E-15 -100.00E-15 1.5000e-01 150.00E-15 -100.00E-15 1.7500e-01 150.00E-15 -100.00E-15 2.0000e-01 150.00E-15 -100.00E-15 2.2500e-01 200.00E-15 -100.00E-15 2.5000e-01 150.00E-15 -100.00E-15 2.7500e-01 200.00E-15 -150.00E-15 3.0000e-01 249.99E-15 -49.998E-15 3.2500e-01 300.00E-15 -100.00E-15 3.5000e-01 550.00E-15 -100.00E-15 3.7500e-01 1.0500E-12 -100.00E-15 4.0000e-01 2.5000E-12 -100.00E-15 4.2500e-01 6.2499E-12 -49.998E-15 4.5000e-01 16.150E-12 50.000E-15 4.7500e-01 42.251E-12 300.00E-15 5.0000e-01 111.35E-12 950.02E-15 5.2500e-01 293.40E-12 2.5000E-12 5.5000e-01 773.16E-12 6.7499E-12 5.7500e-01 2.0369E-09 17.850E-12 6.0000e-01 5.3628E-09 47.050E-12 6.2500e-01 14.100E-09 124.35E-12 6.5000e-01 37.049E-09 328.70E-12 6.7500e-01 97.290E-09 871.01E-12 7.0000e-01 255.59E-09 2.3165E-09 7.2500e-01 669.53E-09 6.1548E-09 7.5000e-01 1.7450E-06 16.250E-09 7.7500e-01 4.5286E-06 43.001E-09 8.0000e-01 11.605E-06 112.75E-09 8.2500e-01 28.915E-06 289.70E-09 8.5000e-01 67.905E-06 710.77E-09 8.7500e-01 145.85E-06 1.6150E-06 9.0000e-01 275.15E-06 3.3005E-06 9.2500e-01 462.25E-06 6.0550E-06 9.5000e-01 702.80E-06 10.229E-06 9.7500e-01 955.70E-06 15.985E-06 1.0000e+00 1.2725E-03 24.235E-06 1.0250e+00 1.5335E-03 37.409E-06 1.0500e+00 1.8115E-03 69.499E-06 1.0750e+00 2.2420E-03 98.251E-06 1.1000e+00 2.5530E-03 154.45E-06 1.1250e+00 2.8836E-03 217.25E-06 1.1500e+00 3.3495E-03 316.20E-06 1.1750e+00 3.6640E-03 405.70E-06 1.2000e+00 4.3366E-03 532.95E-06
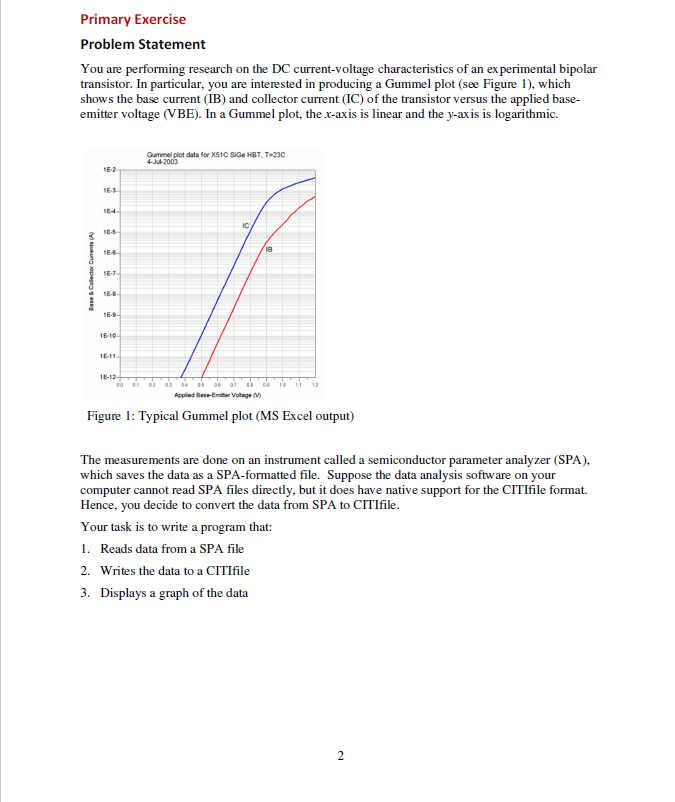
Primary Exercise Problem Statement You are performing research on the DC current-voltage characteristics of an ex perimental bipolar transistor. In particular, you are interested in producing a Gummel plot (see Figure 1), which shows the base current (IB) and collector current (IC) of the transistor versus the applied base- emitter voltage (VBE). In a Gummel plot, the x-axis is linear and the y-ax is is logarithmic. Oumnel pot data for X51C SiGe HE T, T-23C 4Jd 200 Figure 1: Typical Gummel plot (MS Excel output) The measurements are done on an instrument called a semiconductor parameter analyzer (SPA), which saves the data as a SPA-formatted file. Suppose computer cannot read SPA files directly, but it does have native support for the CITIfile format. Hence, you decide to convert the data from SPA to CITIfile Your task is to write a program that: 1. Reads data from a SPA file 2. Writes the data to a CITIfile the data analysis software on your 3. Displays a graph of the data Primary Exercise Problem Statement You are performing research on the DC current-voltage characteristics of an ex perimental bipolar transistor. In particular, you are interested in producing a Gummel plot (see Figure 1), which shows the base current (IB) and collector current (IC) of the transistor versus the applied base- emitter voltage (VBE). In a Gummel plot, the x-axis is linear and the y-ax is is logarithmic. Oumnel pot data for X51C SiGe HE T, T-23C 4Jd 200 Figure 1: Typical Gummel plot (MS Excel output) The measurements are done on an instrument called a semiconductor parameter analyzer (SPA), which saves the data as a SPA-formatted file. Suppose computer cannot read SPA files directly, but it does have native support for the CITIfile format. Hence, you decide to convert the data from SPA to CITIfile Your task is to write a program that: 1. Reads data from a SPA file 2. Writes the data to a CITIfile the data analysis software on your 3. Displays a graph of the data
Step by Step Solution
There are 3 Steps involved in it

Get step-by-step solutions from verified subject matter experts